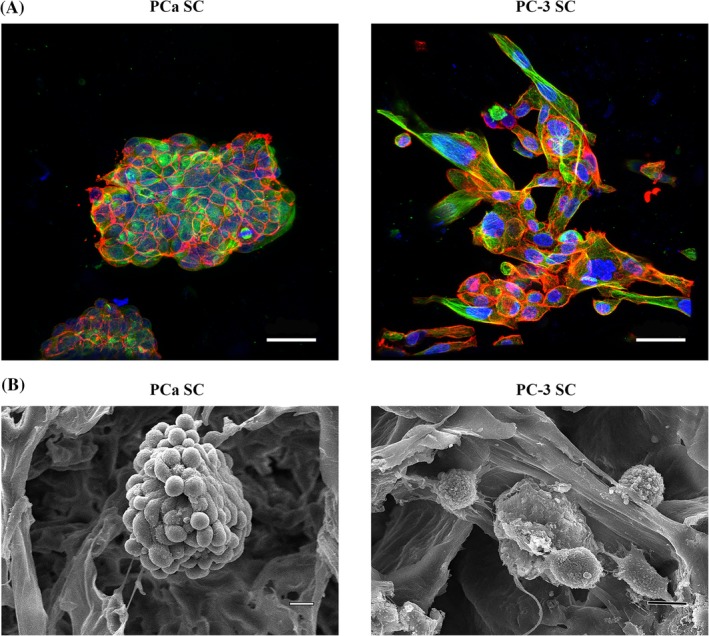
Figure 3.

Morphological analysis of PCa SC and PC‐3 SC. (A) Immunostained α‐tubulin (green), F‐actin (red), and nuclei (blue) in PCa SC and PC‐3 SC. Bar = 50 μm. (B) SEM micrographs of PCa SC and PC‐3 SC showing tumoroid and cluster of cells, respectively, formed in the polycaprolactone/in situ hydroxyapatite‐nanoclay scaffolds. Bar = 10 μm.
