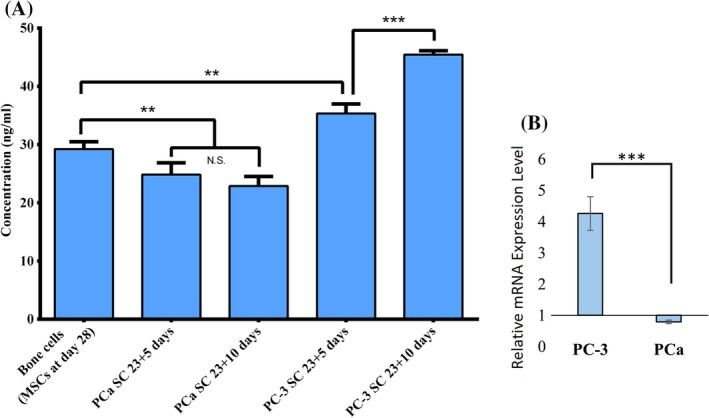
Figure 6.

Osteocalcin (OCN) expression. (A) OCN protein secretion in bone cell, PC‐3 SC, and PCa SC samples measured by ELISA. Results are shown as mean ± SD. Statistical significance is shown by ***p < 0.001, **p < 0.005, *p < 0.05, n = 3. (B) Relative OCN gene expression level at day 23 + 10 in the PC‐3 SC and PCa SC samples, where bone cells (differentiated from mesenchymal stem cells) served as control (relative expression = 1). Results are shown as mean ± SD. Statistical significance is shown by ***p < 0.001, n = 3.
