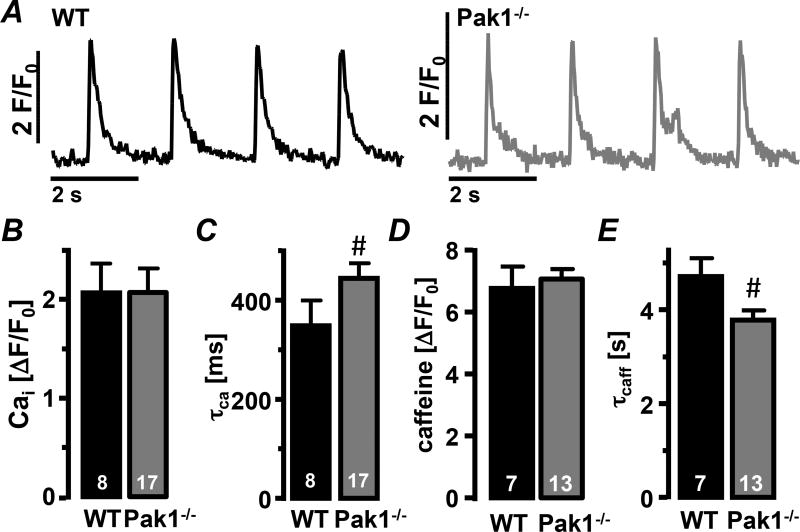
Figure 5. Ca2+ removal shifts from SERCA to NCX in Pak1−/− myocytes.
(A) Field stimulation-induced Ca2+ transients recorded in WT (black) and Pak1−/− (grey) AMs under control conditions. Bar graphs show (B) the Ca2+ transient amplitude and (C) decay constant (τCa), the caffeine transient amplitude (D) and (E) decay constant (τcaff). (#: p < 0.05 compared to WT).

