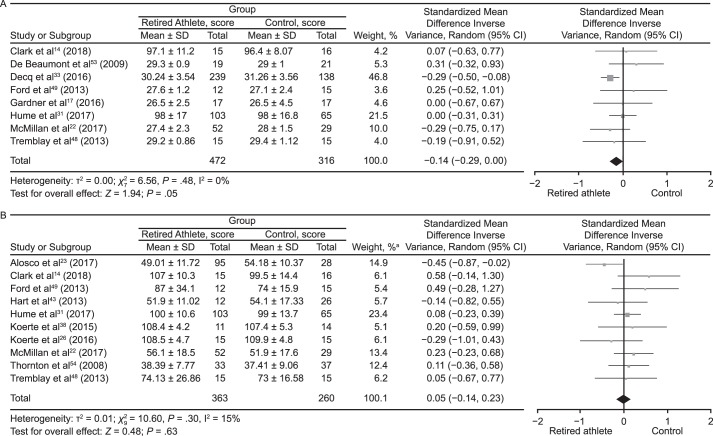
Figure 5.
Forest plots of between-groups comparisons for cognitive domains. Retired athletes compared with control participants in the following areas: A, Global cognitive ability. B, Attention. a The total does not equal 100% because percentages were rounded. Continued on next page.
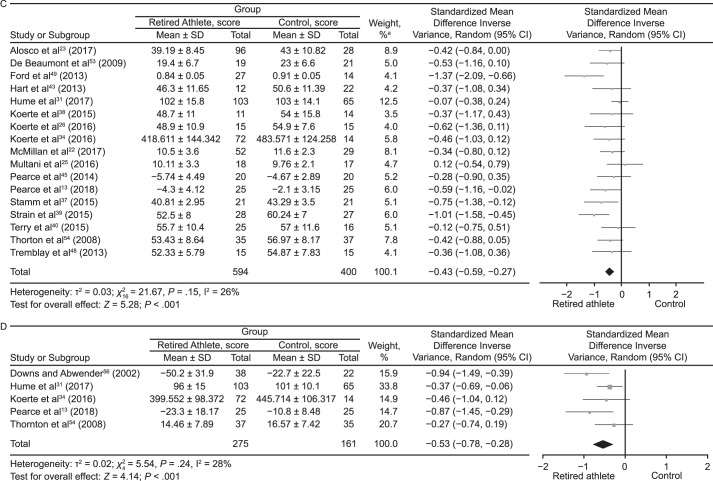
Figure 5.
Continued from previous page. C, Memory. D, Executive function. a The total does not equal 100% because percentages were rounded. Continued on next page.
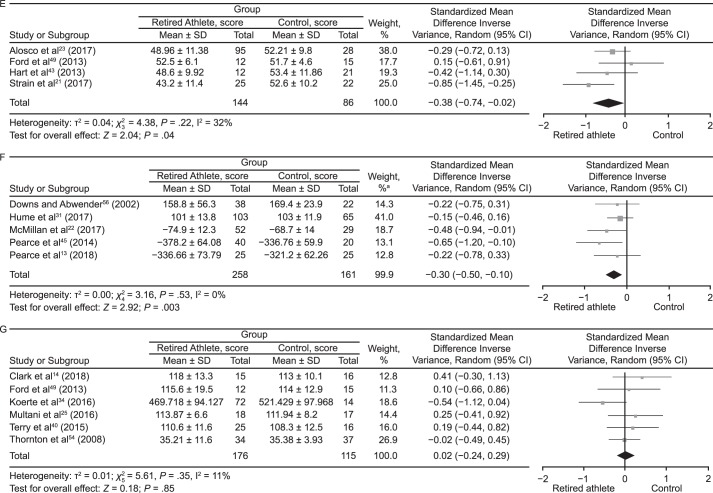
Figure 5.
Continued from previous page. E, Language. F, Psychomotor function. G, Intelligence. a The total does not equal 100% because percentages were rounded. Continued on next page.
Figure 5.
Continued from previous page. H, Self-reported cognitive functioning.


