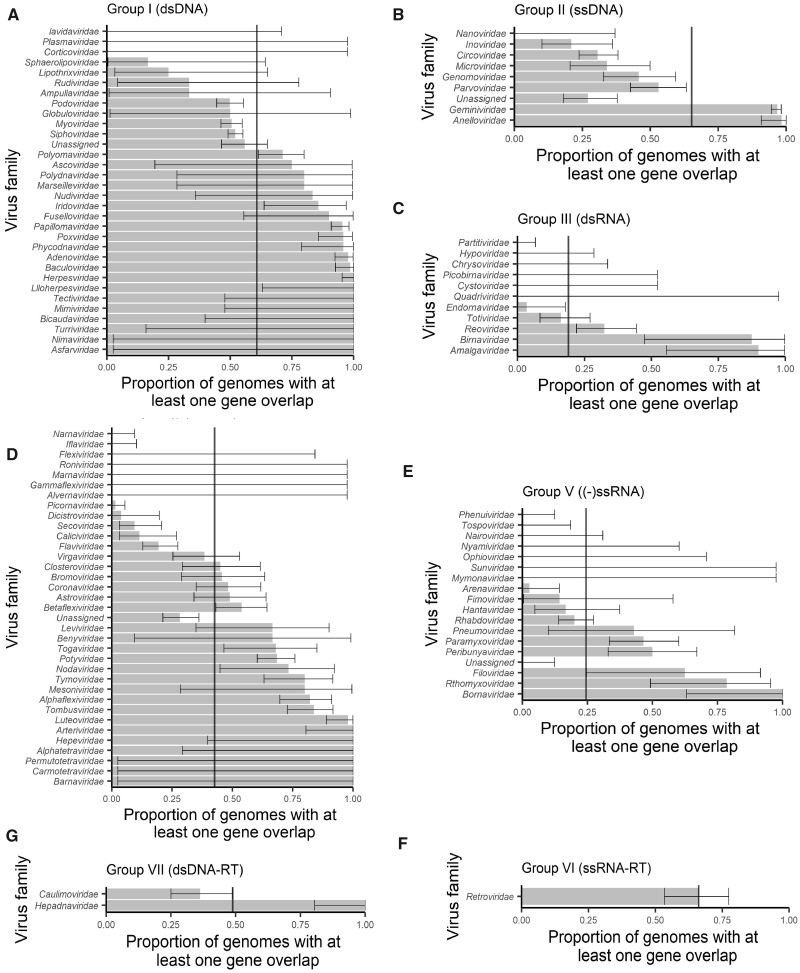
Figure 3.
Proportions of genomes with at least one instance of gene overlap across viral groups, stratified by virus family. Virus families are ordered by their proportion and then the width of the confidence intervals. Error bars represent 95 per cent CIs for the proportion within a family. Vertical lines represent overall means within a viral genome group.

