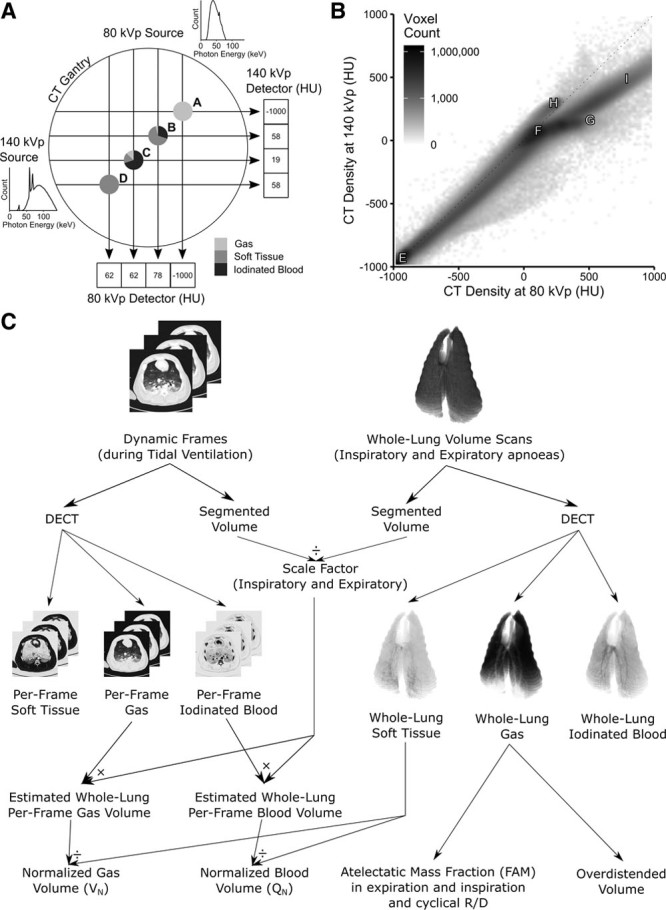
Figure 1.

Methodology. A, Schematic of dual-source CT scanner gantry showing two separate x-ray sources at 90 degree offsets with example photon energies density distributions demonstrating minimal overlap between the two (140 kVp spectrum has low-energy photons attenuated by a 0.4 mm tin filter). Points A–D represent examples of imaged objects with distinct compositions. Point A is 100% gas and is reliably interpreted as –1,000 Hounsfield units (HU) at both energy levels. Point B, however, is composed of three different materials but is interpreted as 58 HU at 140 kVp, the same as a voxel comprising 100% soft tissue (point D). When points B and D are imaged at 80 kVp, they have different CT densities (78 and 62 HU), thus the materials can be differentiated. A similar argument exists for point C. B, In general, after plotting the CT densities of all voxels in an image (here one of the volume scans used for this paper), various distributions can be seen. Point E—100% gas; F—100% soft tissue; G—100% iodinated blood; H—CT scanner table; I—bone. All voxels containing a mix of purely gas and soft tissue fall along the identity line; however, if iodine is added, they are displaced from this line, thus allowing the composition of the voxel to be identified. C, Normalization of dynamic dual-energy CT (DECT) gas and iodinated blood volumes to lung tissue mass. Individual frames were scaled up to the size of the whole lung using a scale factor defined as the ratio of the entire thorax to the slice and then divided by the mass of soft tissue in the whole lung. Whole lung gas volumes were used to calculate fractional atelectatic mass in expiration, cyclical recruitment/derecruitment (R/D), and overdistended volume.
