
Figure 8.
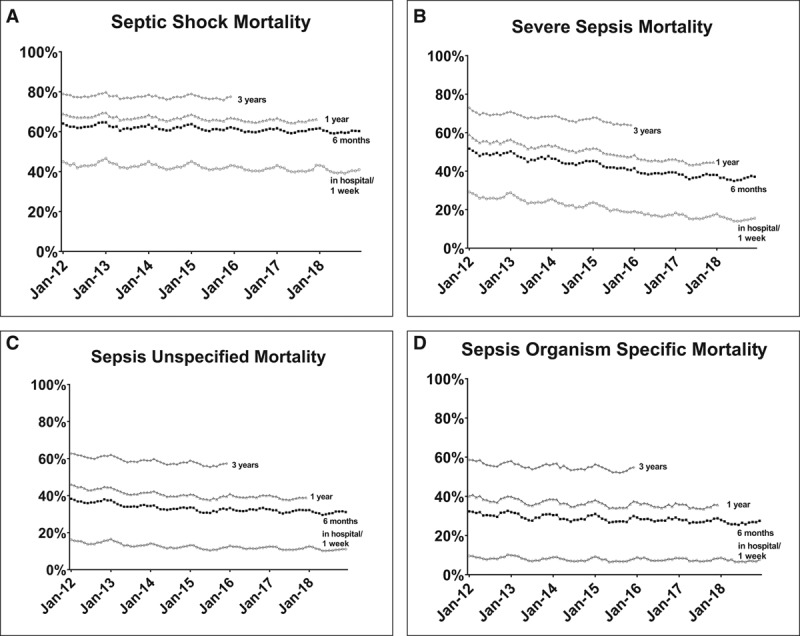
Mortality of sepsis stratified by severity and presented as monthly cohorts. Filled circles, 1-wk mortality; filled squares, 6-mo mortality; filled triangles (pointing up), 1-yr mortality; filled triangles (pointing down), 3-yr mortality. Each month represents a cohort of ≈70,000–100,000 Medicare Fee-For Service sepsis patients, of which approximately one-quarter of the total are septic shock admissions, one-fifth of the total are severe sepsis admissions, and the balance are less severe sepsis admissions. Among the four stratifications, no monthly cohort (i.e., no column representing 1 mo in any of the four graphs) contains fewer than 11,000 admissions. The mortality decline is greatest among those with severe sepsis, and the lives appear to be being saved during the hospitalization (the longer-term mortalities decline in parallel). One hypothesis is that early and aggressive case finding and treatment are preventing progression (i.e., to more severe organ dysfunction and shock).