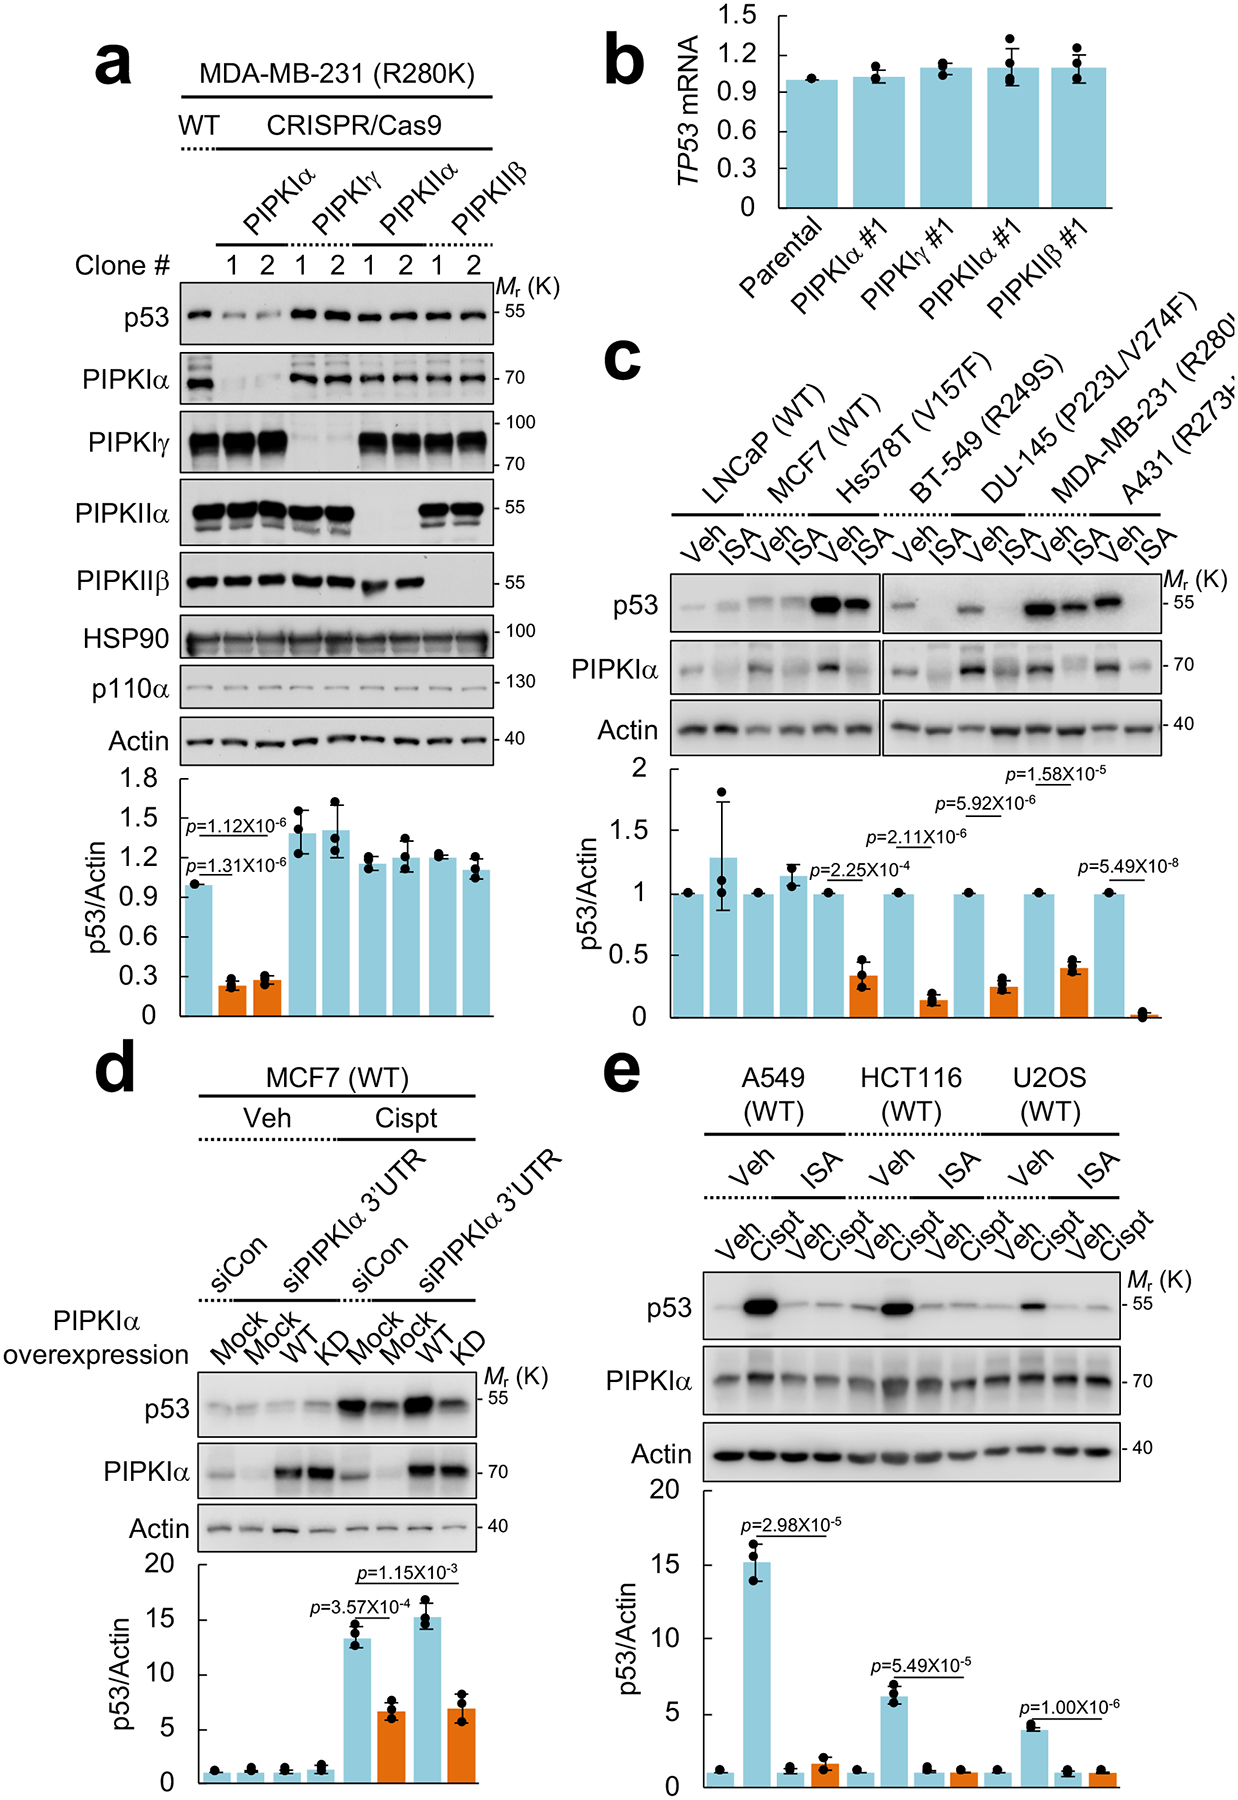
Figure 1. PI4,5P2 generation by PIPKIα is required for stress-induced and mutant p53 stability.

(A) Nuclear PIPKs were knocked out with CRISPR-Cas9 system in MDA-MB-231 cells. Expression of the indicated proteins was analyzed by immunoblotting (IB). Intensity of immunoblots was quantified and the graph is shown as mean ± SD n=3 independent experiments. One-sided paired Student t-tests were used for statistical analysis (*, p<0.05; **, p<0.01).
(B) RT-PCR analysis of TP53 mRNA. TP53 mRNA levels were normalized to GAPDH mRNA. The graph is shown as mean ± SD of n=4 independent experiments.
(C) The indicated cells were treated with 50 μM ISA-2011B (ISA) for 72 h. Protein expression was analyzed by IB, the intensity of p53 and actin bands was quantified, and the graph is shown as mean ± SD of n=3 independent experiments. An equivalent concentration of DMSO was used as a vehicle (Veh) control. One-sided paired Student t-tests were used for statistical analysis.
(D) MCF7 cells were transfected with the indicated siRNAs and DNA constructs. After 48 h transfection, cells were treated with 30 μM cisplatin (Cispt) for an additional 24 h. Expression of the indicated proteins was analyzed by IB, p53 immunoblots were quantified and the graph is shown as mean ± SD of n=3 independent experiments. WT, wild-type; KD, kinase-dead mutant; 3’UTR, 3’ untranslated region. One-sided paired Student t-tests were used for statistical analysis.
(E) Indicated cells expressing wild-type p53 were treated with 30 μM cisplatin and 50 μM of ISA-2011B for 24 h. Protein expression was analyzed by IB. p53 blots were quantified and the graph is shown as mean ± SD of n=3 independent experiments. One-sided paired Student t-tests were used for statistical analysis.
