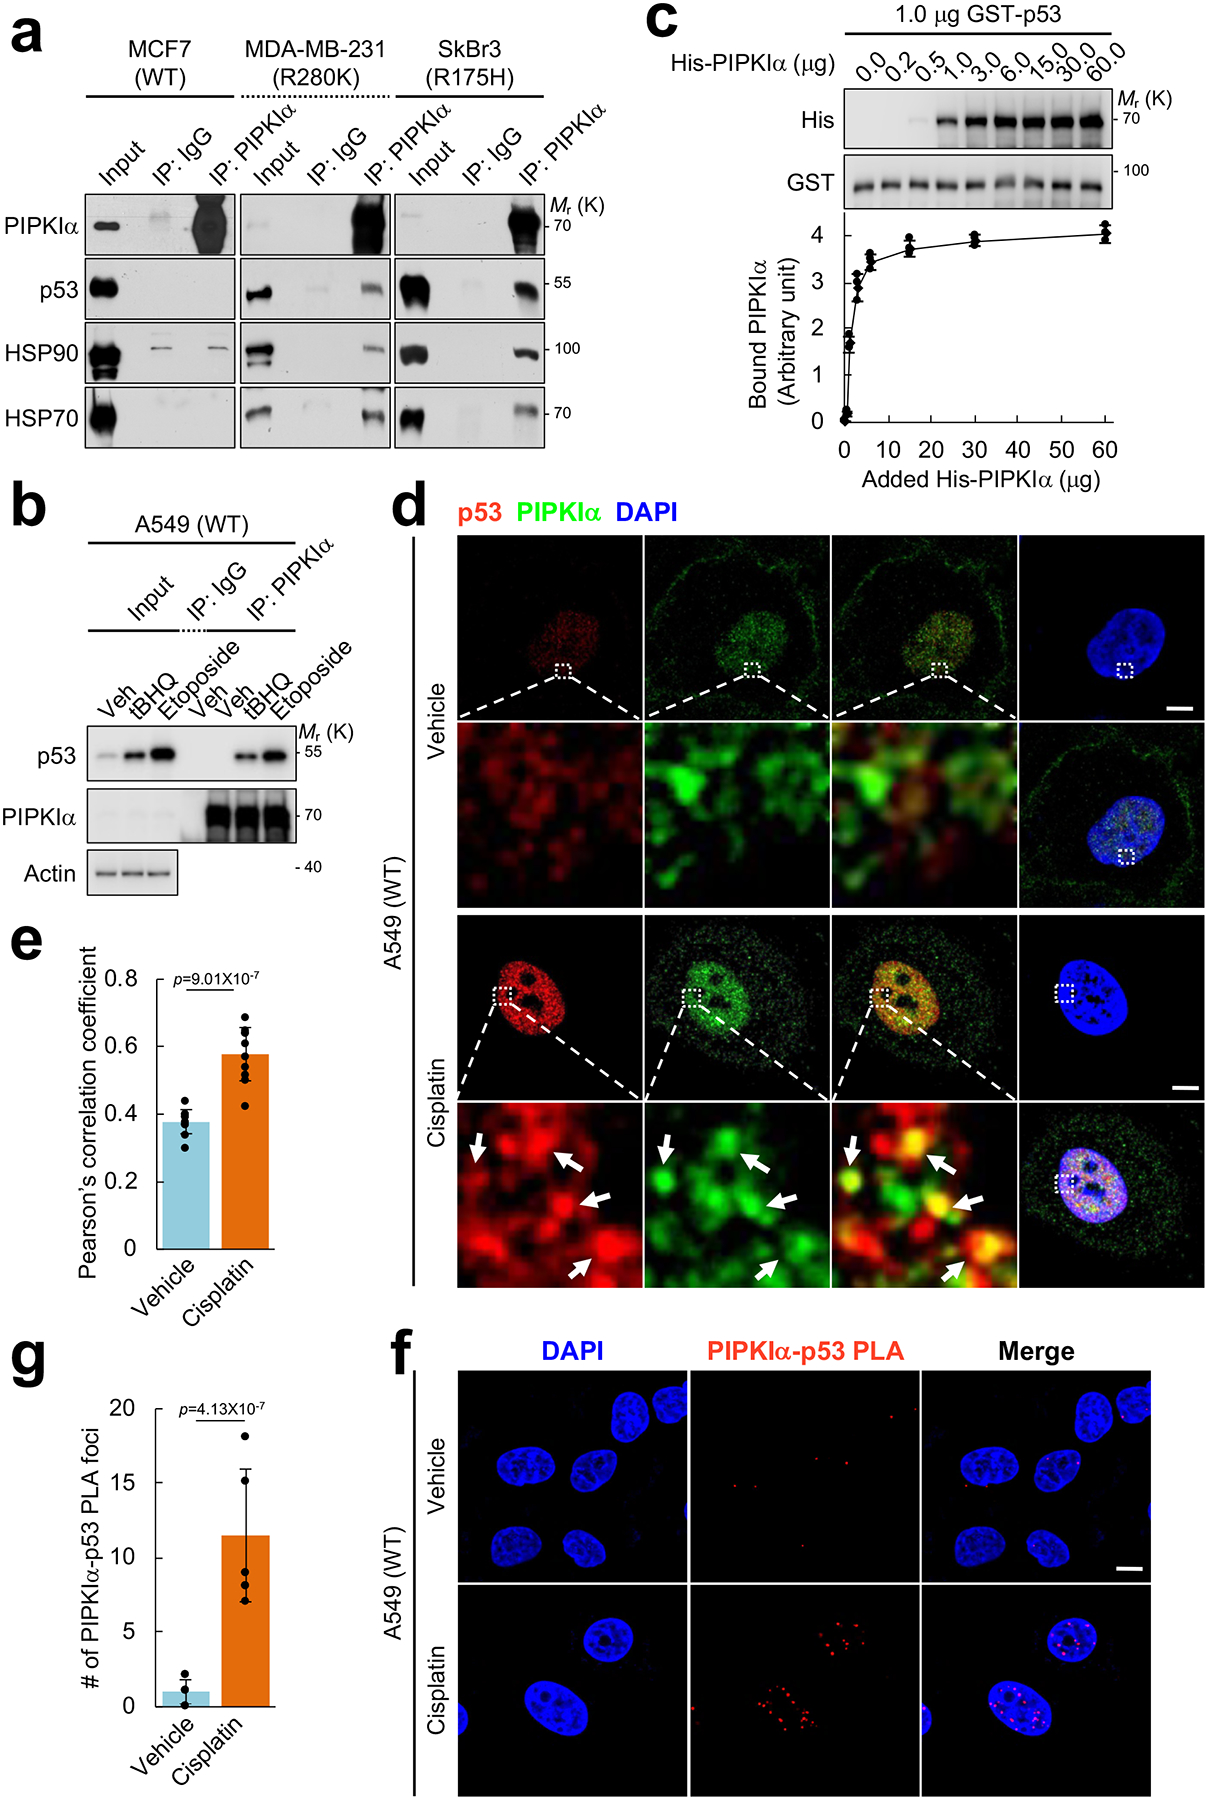
Figure 2. PIPKIα associates with p53 in the nucleus.

(A) Endogenous PIPKIα was immunoprecipitated (IP’ed) from the indicated breast cancer cells and the associated proteins were analyzed by IB. Normal immunoglobulin (IgG) was used as a negative control. Representative data of n=3 independent experiments were shown.
(B) A549 cells were treated with 100 μM tBHQ, 100 μM etoposide, or a vehicle control (DMSO) for 24 h. Endogenous PIPKIα was IP’ed and the associated proteins were analyzed by IB. Representative data of n=3 independent experiments were shown.
(C) 1.0 μg recombinant GST-p53 immobilized on glutathione beads was incubated with the indicated amount of His-PIPKIα in vitro. The complex was pulled down and p53-bound PIPKIα was analyzed by IB with an anti-His antibody. The graph is shown as mean ± SD of n=3 independent experiments.
(D and E) A549 cells were treated with 30 μM cisplatin for 24 h before processed for immunofluorescence (IF) staining against PIPKIα and p53. DAPI was used to stain nucleic acids. The images were taken with a Leica SP8 confocal microscope and processed by ImageJ. White arrows indicate the colocalized signals. The experiments were repeated three times and the graph is shown as mean ± SD of n=10 cells. Scale bar, 5 μm.
(F and G) A549 cells were treated with 30 μM cisplatin for 24 h before processed for proximity ligation assay (PLA) between PIPKIα and p53. DAPI was used to stain nucleic acids. The images were taken with a Leica SP8 confocal microscope. The red PLA signal was quantified by LAS X (Leica) and the graph is shown as mean ± SD of n=10 cells. Scale bar, 5 μm. The experiments were repeated at least 3 times. Two-sided paired Student t-tests were used for statistical analysis (*, p<0.05; **, p<0.01).
