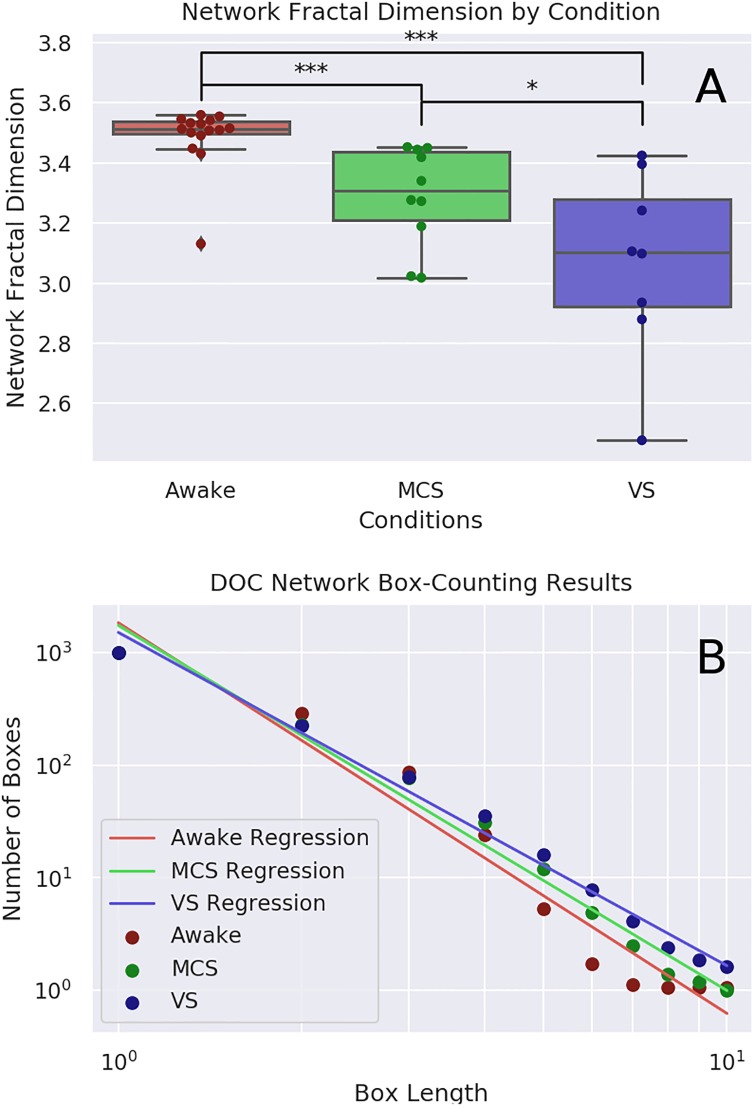
Fig 3. Network FD analysis.
A: Visualization of the fractal dimension of functional connectivity networks as determined by the Compact Box Burning algorithm. Mean dB for the healthy control condition: 3.49 ± 0.1 (n = 15), for MCS patients: 3.29 ± 0.16 (n = 10), and for VS patients: 3.07 ± 0.29 (n = 8). Box length must always take integer values and does not have a regular metric unit. Post-hoc analysis with the Mann-Whitney U test found significant differences between each condition: control vs. MCS (H(41), p-value = 0.032), control vs. VS (H(23), p-value = 0.009), and MCS vs. VS (H(20), p-value = 0.042). B shows the relationship between lB and N(lB) in all three conditions.

