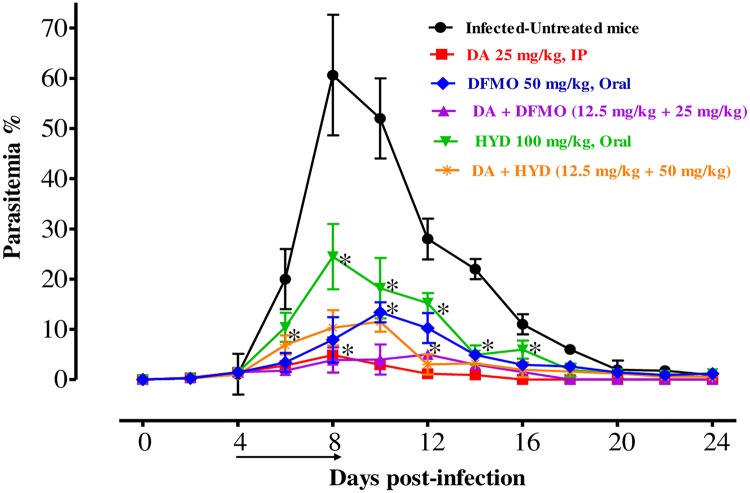
Fig 3. In vivo growth inhibition of HYD and DFMO against B. microti.
Graph reveals the chemotherapeutic potential of HYD–DA and DFMO–DA when compared to the positive group. The asterisks (*) show significant variation (P < 0.05) between drug-treated and positive groups. The arrow shows 5 successive days of drug administration starting from day 4 to 8 p.i.

