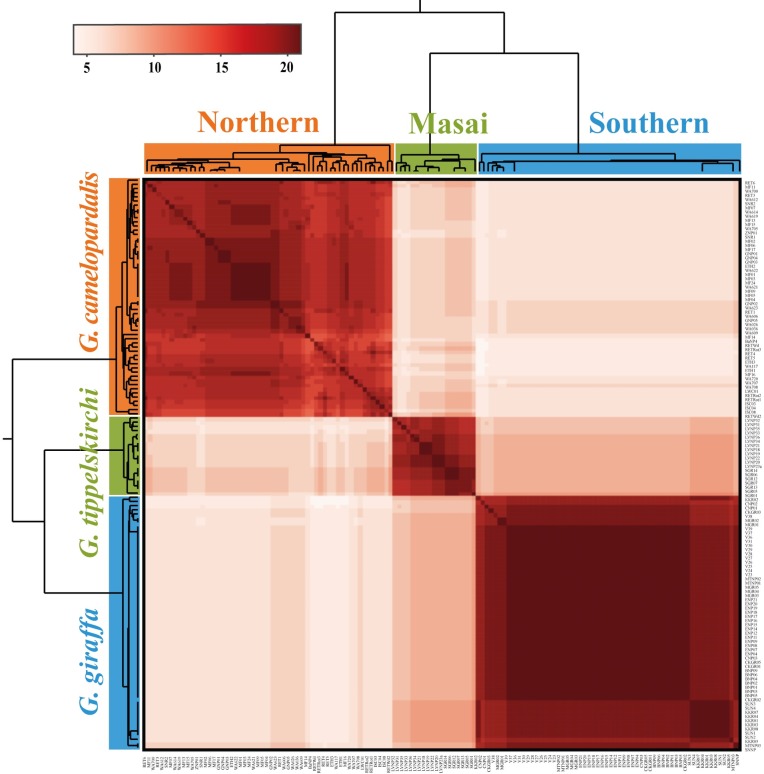
Fig 5. Conspecificity matrix of giraffe taxa.
The conspecificity matrix was generated by calculating for each pair of individuals a conspecificity score equal to the number of independent markers supporting the hypothesis of conspecificity in haploweb analyses of the 21 introns. The conspecificity matrix was visualized as a heat map in which the highest scores (21 out of 21) are shown in dark red, the lowest scores (0 of 21) are shown in white and intermediate scores are depicted in various nuances of red.

