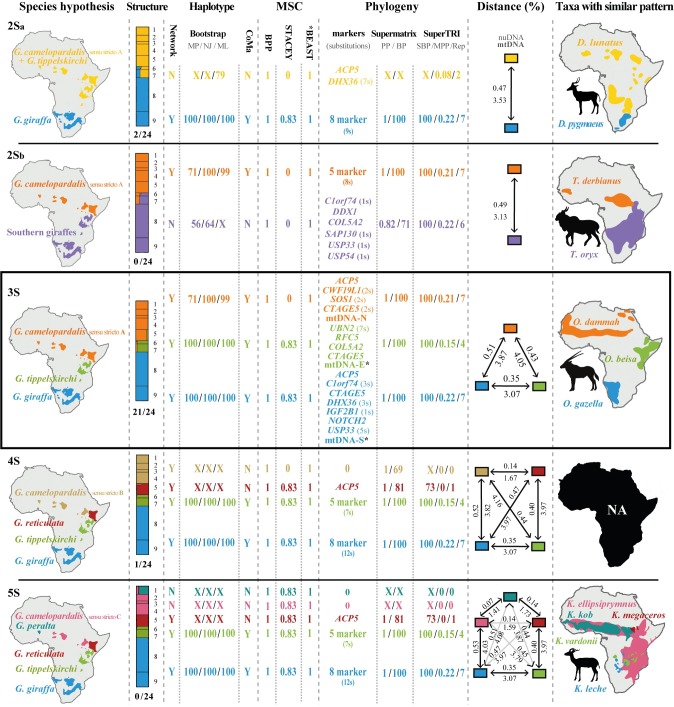
Fig 6. The five molecular hypotheses for giraffe taxonomy.
The five taxonomic hypotheses that received some support from our analyses on giraffes show the existence of two species, with two possible geographic patterns (2Sa and 2Sb hypotheses), three species (3S hypothesis), i.e. G. camelopardalis sensu stricto A, G. giraffa and G. tippelskirchi, four species (4S hypothesis), i.e. G. camelopardalis sensu stricto B, G. giraffa, G. reticulata, and G. tippelskirchi, or five species (5S hypothesis), i.e. G. camelopardalis sensu stricto C, G. giraffa, G. peralta, G. reticulata, and G. tippelskirchi. In the first column are drawn the geographic distributions of giraffe species for each of the five taxonomic hypotheses. In the second column are summarized the results obtained from STRUCTURE analyses. Barplots were illustrated with DISTRUCT (1 = peralta, 2 = antiquorum, 3 = camelopardalis, 4 = rothschildi, 5 = reticulata, 6 = tippelskirchi, 7 = thornicrofti, 8 = giraffa, 9 = angolensis) and number of analyses supporting each taxonomic hypothesis (in total 24, see Table 3) is indicated beneath barplots. In the third column are illustrated the results obtained in the different haplotype analyses, including the network analysis (Y = yes, the species represents a cluster; N = no, the species is not found as a cluster), the bootstrap values obtained with the phylogenetic analyses based on the Maximum Parsimony (MP), Distance (NJ) and Maximum Likelihood (ML) criterion (“X“: support < 50) and the conspecificity matrix (CoMa) (Y = yes, the species is supported by the analysis; N = no, the species is not supported by the analysis). In the fourth column are shown the support values provided by the three Multispecies coalescent (MSC) methods, i.e. BPP, STACEY and *BEAST. In the fifth column are listed the results obtained in the phylogenetic analyses including the markers supporting each taxonomic hypothesis in the separate analyses of 21 introns and mtDNA, as well as the support values obtained from supermatrix (PP = posterior probability; BP = bootstrap percentage) and SuperTRI analyses (SBP = SuperTri Bootstrap Percentage; MPP = Mean Posterior Probability; Rep = Reproducibility Index) (“-“: not found). In the sixth column are detailed the mean pairwise distances between individuals of the same taxon calculated using either nuDNA data (concatenation of 21 introns, above) or mtDNA (below) (Since all the mitochondrial sequences of the subspecies giraffa belong to haplogroup E, they were considered as tippelskirchi for distance comparisons; see Discussion for more details on mtDNA introgression). In the seventh column are shown the distribution maps of bovid genera with a similar geographic pattern of speciation.

