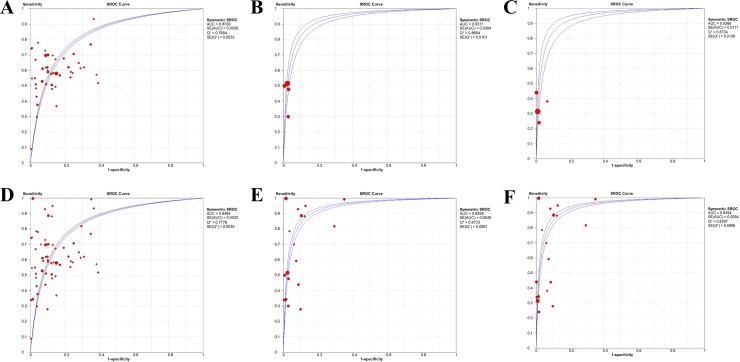
Fig 5. Summary receiver operating characteristic curves (SROC).
(A). SROC curve for AFP in 20–100 ng/mL. (B). SROC curve for AFP in 200 ng/mL. (C). SROC curve for AFP in 400 ng/mL. (D) SROC curve for AFP in 20–100 ng/mL combined with ultrasound. (E) SROC curve for AFP in 200 ng/mL combined with ultrasound. (F) SROC curve for AFP in 400 ng/mL combined with ultrasound.

