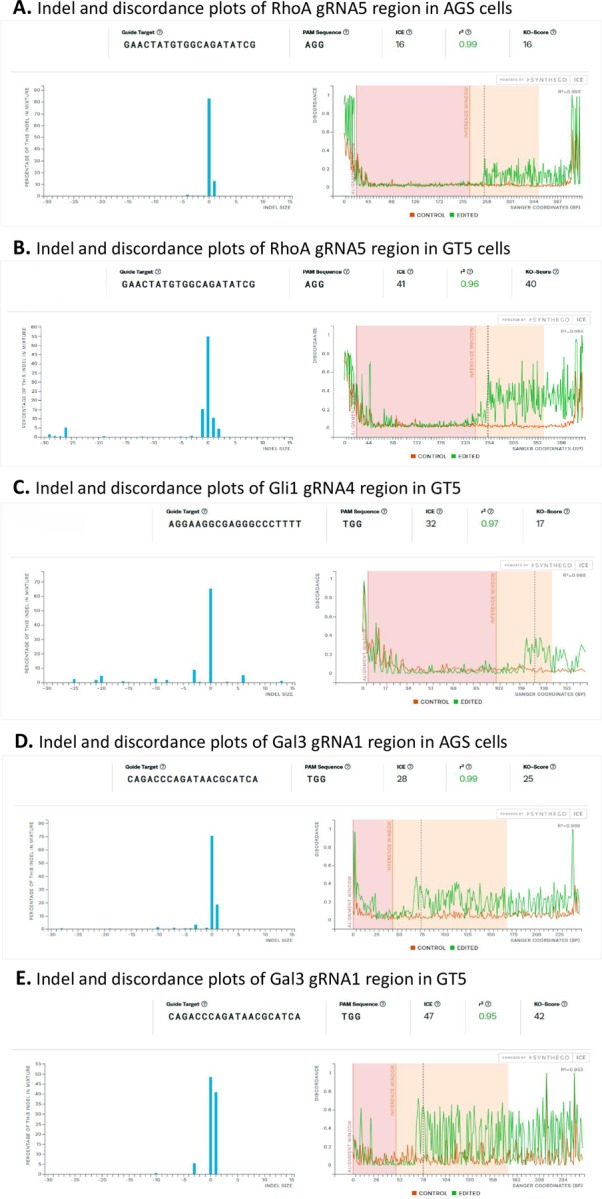
Fig 5. ICE (Inference of CRISPR edits) analyses showing indel and discordance plots.

A. The RhoA gRNA5 region in AGS cells showing a knockout (KO) score of 16. B. The RhoA gRNA5 region in GT5 cells showing a KO score of 40. C. The Gli1 gRNA4 region in GT5 cells showing a KO score of 17. D. The Gal3 gRNA1 region in AGS cells showing a KO score of 25. E. The Gal3 gRNA1 region in GT5 cells showing a KO score of 42.
