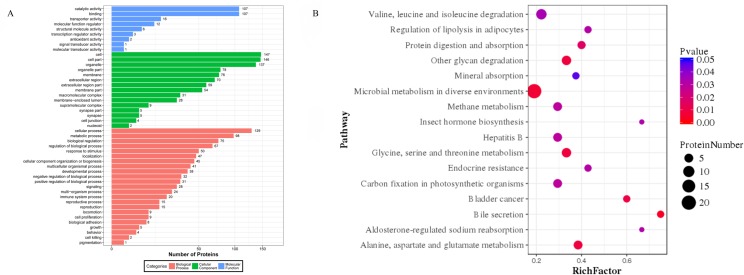
Fig 6. Bar graph of gene ontology (GO) classification and bubble chart of Kyoto encyclopedia of genes and genomes (KEGG) pathway (B) analysis of differentially expressed proteins in ram vs. buck spermatozoa.
The bar length (A) and bubble size (B) show the number of all differentially abundant proteins associated with the GO and KEGG term.

