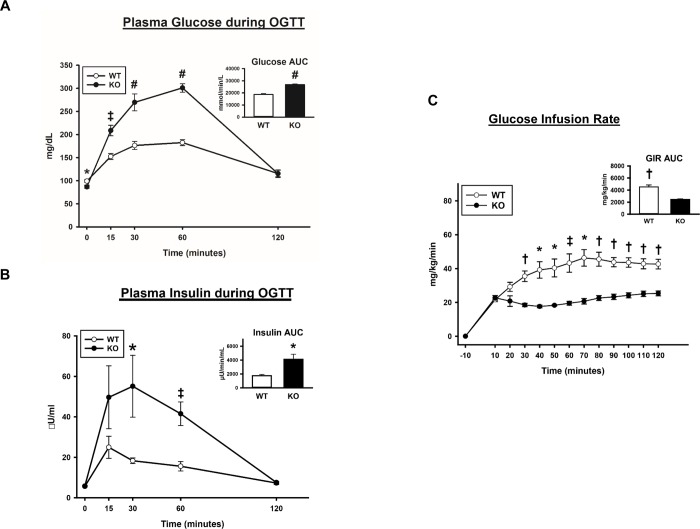
Fig 2. Oral glucose tolerance test = OGTT.
Glucose infusion rate = GIR during the HEC in wildtype (WT; white bars and white circles) and AS160-KO (K O; black bars and black circles) rats. Area under the curve (AUC; inset) for (A) glucose and (B) insulin. Data were analyzed by Student’s t-test. *P<0.05, ‡P<0.005 and #P<0.001 for WT versus KO rats. Means ± SEM for 6 rats of each genotype. (C) GIR for rats during the HEC. AUC for GIR (inset). Data were analyzed by Student’s t-test. *P<0.05, †P<0.001 and ‡P<0.005 for WT versus KO. Means ± SEM for 4 rats of each genotype.

