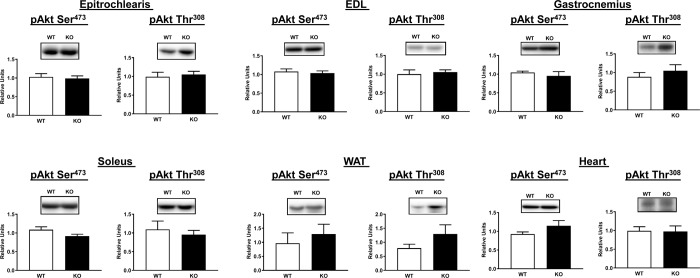
Fig 4. Akt phosphorylation on Ser473 (pAkt Ser473) and Thr308 (pAkt Thr308) in tissues from WT (white bars) and KO (black bars) animals subjected to the HEC.
Extensor digitorum longus = EDL. White adipose tissue = WAT. To improve the clarity of these figures loading controls (Memcode protein stain) are not included on this figure or on subsequent figures (no genotype-related differences were found for any of the loading controls). Means ± SEM for 4 rats of each genotype.

