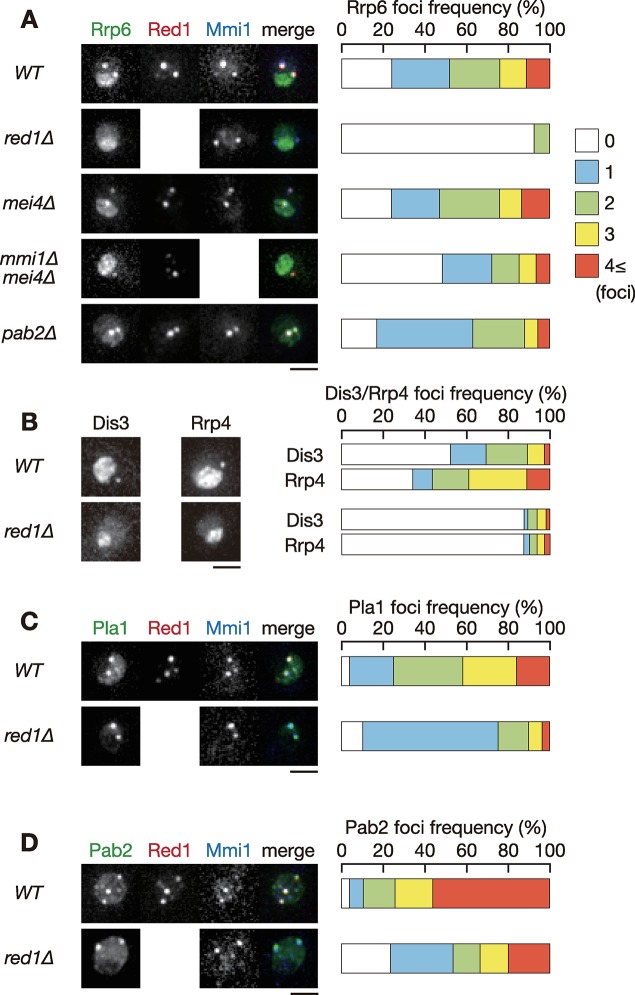
Fig 1. Red1 is required for nuclear foci formation of exosome.
(A) Localization of Rrp6, Red1 and Mmi1 in wild-type, red1Δ, mei4Δ, mmi1Δ mei4Δ, and pab2Δ cells. Cells expressing Rrp6-YFP (green), Red1-mCherry (red) or CFP-Mmi1 (blue) from the respective endogenous loci were observed during exponential growth in YE liquid medium. Images of the nuclear region are shown. Frequencies of cells containing 0, 1, 2, 3, or 4 and more Rrp6 foci are indicated on the right (n > 100). (B) Localization of Dis3 and Rrp4 in wild-type and red1Δ cells. red1Δ cells expressing Dis3-GFP or Rrp4-GFP from the respective endogenous loci were observed. Frequencies of cells containing 0, 1, 2, 3, or 4 and more Dis3 or Rrp4 foci are indicated (n > 100). (C) Localization of Pla1, Red1 and Mmi1 in wild-type and red1Δ cells. Cells expressing Pla1-YFP (green), Red1-mCherry (red) and CFP-Mmi1 (blue) were examined. Frequencies of cells containing 0, 1, 2, 3, or 4 and more Pla1 foci are indicated (n > 100). (D) Localization of Pab2, Red1, and Mmi1 in wild-type and red1Δ cells. Cells expressing Pab2-YFP (green), Red1-mCherry (red) and CFP-Mmi1 (blue) were examined. Frequencies of cells containing 0, 1, 2, 3, or 4 and more Pab2 foci are indicated (n > 100). Scale bars: 2 μm.

