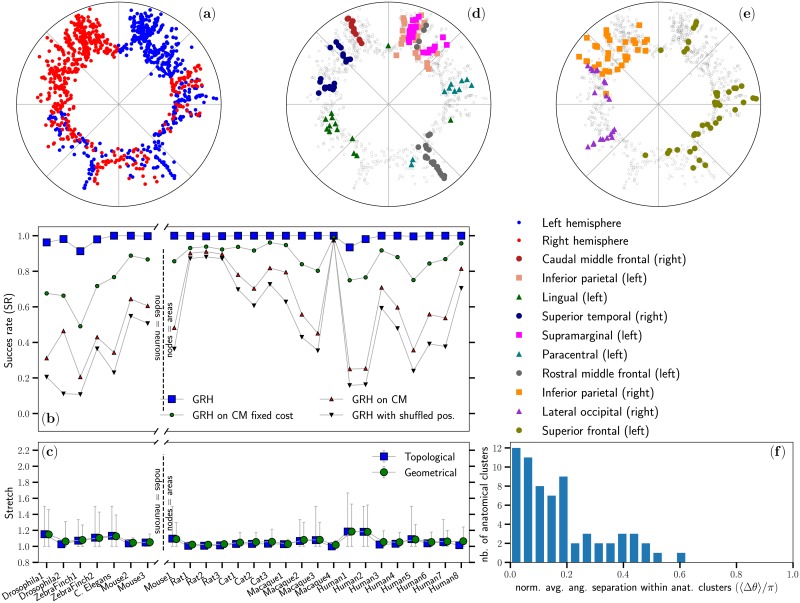
Fig 4.
(a) The connectome Human5 embedded in the hyperbolic disk. Nodes belonging to the two different hemispheres are shown in blue and red. See Materials and methods for details on this representation. (b) Success rate (SR) of the greedy routing protocol for the hyperbolic embeddings of several connectomes (GRH) as well as for randomized versions of these connectomes generated using the three null models presented in the Materials and Methods section. As in Fig 2, the x-axis is broken to highlight the difference between connectomes at the neuron level from the ones where nodes correspond to areas of the brain. Within these two resolution categories, the ordering of the connectomes from left to right roughly follows the increasing physical volume they occupy. (c) Average stretch of the greedy paths in each connectome with the error bars showing the 10% and 90% percentiles. (d)–(e) A sample of representative neuroanatomical regions from the DK atlas are superimposed over the inferred positions of nodes shown on (a). (f) Distribution of the average normalized angular separation between every pair of nodes belonging to the same neuroanatomical regions defined by the DK atlas.

