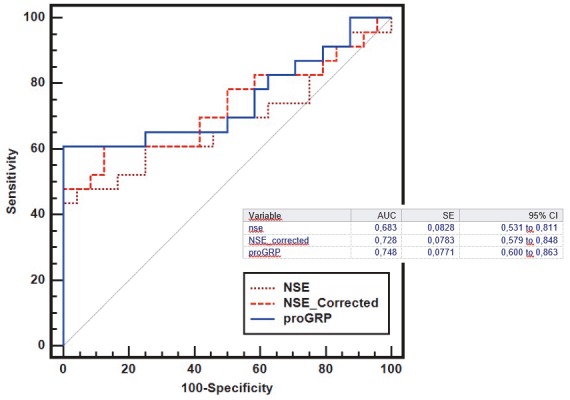
Figure 2.

Multiple ROC analysis of ProGRP (progastrin-releasing peptide), NSE (neuron-specific enolase), and adjusted NSE values, which are significant in distinguishing the healthy group from the pulmonary neuroendocrine tumor (PNET) group; P > 0.05 for all values. AUC, Area under the curve; SE, standard error of the AUC; ProGRP, progastrin-releasing peptide; NSE, neuron-specific enolase. Statistics using two-tailed Z-test.
