Figure 1.

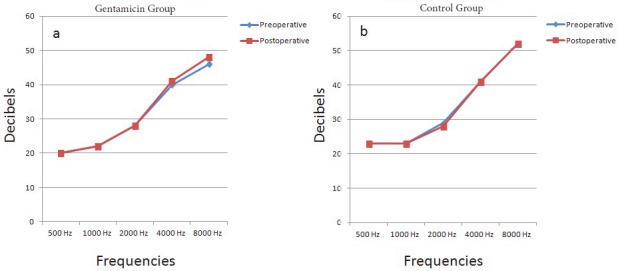
The line charts demonstrating the comparison of pre- and postoperative mean decibels at each frequency in (a) gentamicin group and (b) control group.

The line charts demonstrating the comparison of pre- and postoperative mean decibels at each frequency in (a) gentamicin group and (b) control group.