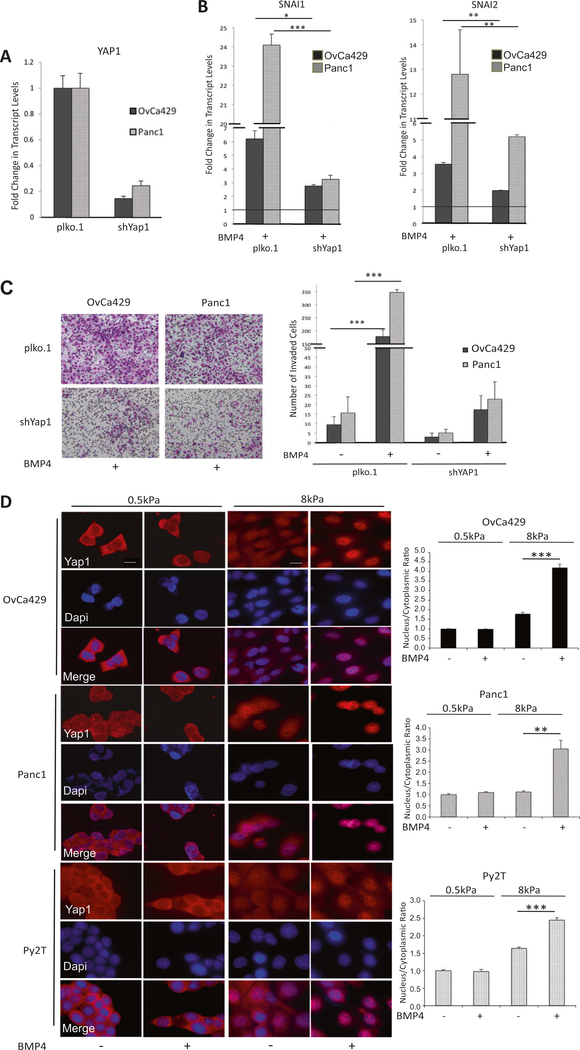
Fig. 4.
YAP1 enhances BMP4-induced EMT. a Real-time quantitative PCR of YAP1 mRNA in control and knockdown cell lines as indicated. b Relative change in transcription factors determined by qRT-PCR of SNAI1 and SNAI2 in OvCa429 and Panc1 cells expressing shYAP1 or shPlko.1 after being treated with BMP4 (10 nM) as described in Methods. Values are normalized to their untreated control (black horizontal line in b) c OvCa429 and Panc1 cells expressing shYAP1 or shPlko.1 were plated in transwell chambers coated with Matrigel in the absence or presence of BMP4 (10 nM). Cell invasion imaged after 18 h. (Right) Graphical representation of number of invaded cells from four independent fields. Error bars represent the standard error of the mean. d Immunofluorescence images of OvCa429, Panc1, and Py2T cells plated on soft (0.5 kPa) and rigid (8 kPa) fibronectin-coated PA hydrogels and then treated with BMP4 (10 nM) for 1 h. Cells were then immunostained with anti-YAP1. Scale bar = 20μm. Quantitation of nuclear to cytoplasmic fluorescence intensity ratio is presented for each cell line (right graphs). *p < 0.05, **p < 0.01, ***p < 0.001

