Fig. 7.

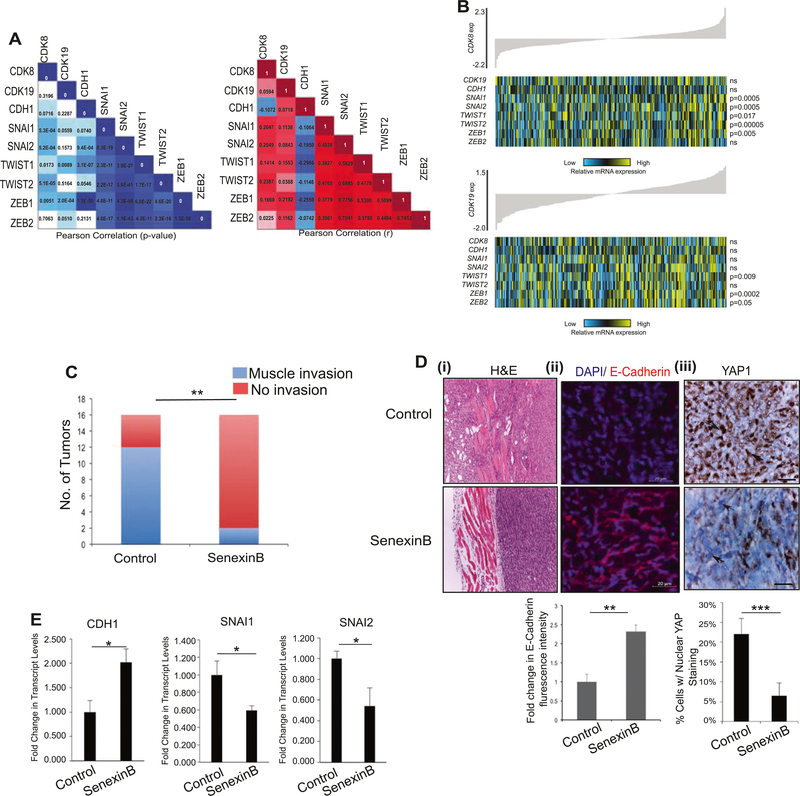
CDK8/19 correlates with markers of EMT in patients and inhibits EMT-associated invasion in vivo. a Pearson correlation demonstrating association between CDK8 and CDK19 with EMT markers in a panel of 283 high-grade serous ovarian tumors from TCGA. The left panel shows resulting p values while the right indicates the r-value. b Heat map of expression of CDK8 (upper panel) correlated with the expression of EMT markers SNAI1, SNAI2, TWIST1, TWIST2, and ZEB1 in high-grade serous ovarian tumors (n = 283). CDK19 expression (lower panel) corresponds with TWIST1 and ZEB1 mRNA levels. In each panel, tumor samples are arranged based on CDK8 or CDK19 expression, respectively, and relative expression of each gene is shown in the associated heat map; blue indicates low expression, whereas yellow corresponds to high mRNA levels. c–e 1 × 10⁶ Py2T cells were injected into right and left mammary fat pads of FVB mice (n = 8/group, 16 tumors). After the appearance of measurable tumors on day 6, mice were randomized and fed either Senexin B medicated diet (Methods) or a normal diet. Mice were euthanized 32 days after implantation. c Tumors were analyzed at necropsy. Graph represents the number of tumors in either group with notable invasion into the muscle **p < 0.005 Χ2-test. d (i–iii) Representative images of tumor sections from c (i) H&E staining of invasion into muscle from tumors in c, (ii) confocal fluorescence images after immunostaining of tumor sections for E- cadherin and DAPI as indicated and described in Methods. Graph below represents fluorescence intensity quantitation from average of 10 random areas per sample from two independent tumors per group normalized to control tumor sections. (iii) Immunohistochemical staining of tumor sections labeled using anti-YAP1 as described in Methods. Arrows indicate YAP stained/unstained nuclei. Scale bar = 20μm. Graph below represents quantitation of percentage of tumor cells with nuclear YAP staining calculated in five random areas per sample from two independent tumors per group (Methods). e Real-time quantitative PCR of RNA extracted from tumors in c showing the mRNA levels for E-Cadherin (CDH1), and transcription factors SNAI1 and SNAI2 (n = 3 tumors/group) normalized to control tumors
