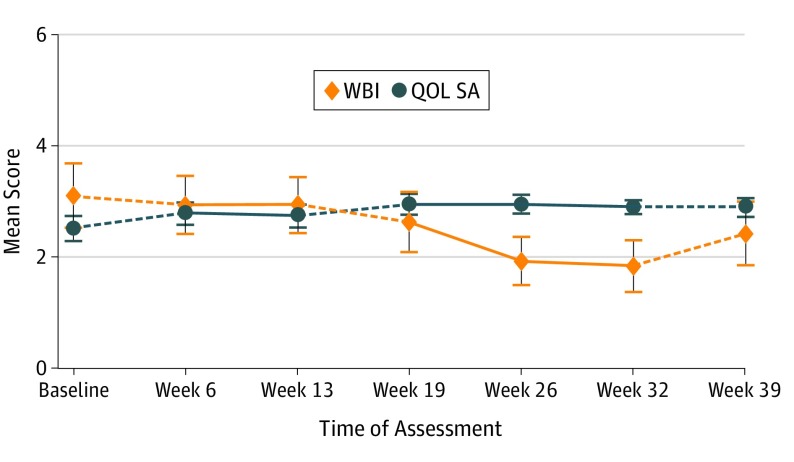
Figure 3. Mean (SE) Resident and Fellow Well-Being Index (WBI) and Quality-of-Life Single-Item Self-Assessment (QOL SA) Scores at Each Assessment for 19 Residents.
For the WBI, lower scores indicate better well-being, and for the QOL SA, higher scores indicate better well-being. Solid lines indicate intervention phases, and dashed lines indicate no-intervention phases.

