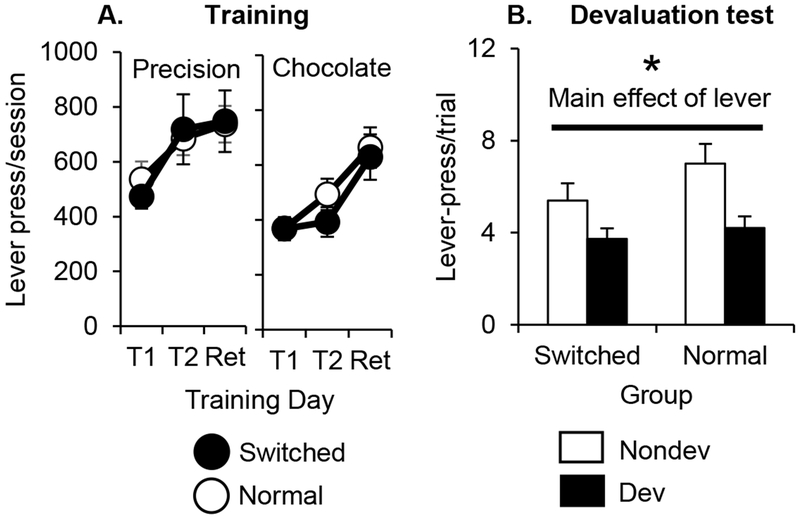
Figure 4:
A. Lever presses/session (mean ± SEM) during the first and second training cued-trial training days and retraining days for each pellet in Exp. 2 (divided by pellet type). Left panel represents responding for precision pellets. Right panel represents responding for chocolate-flavored sucrose pellets. Black circles represent rats in the Cue Switched group. White circles represent rats in the Cue Normal group. B. Lever presses/trial (mean ± SEM) during the devaluation test session in Exp 2 (averaged across trial). White bars represent responding on the nondevalued lever. Black bars represent responding on the devalued lever. Nondev = nondevalued lever. Dev = devalued lever. * = p<0.05

