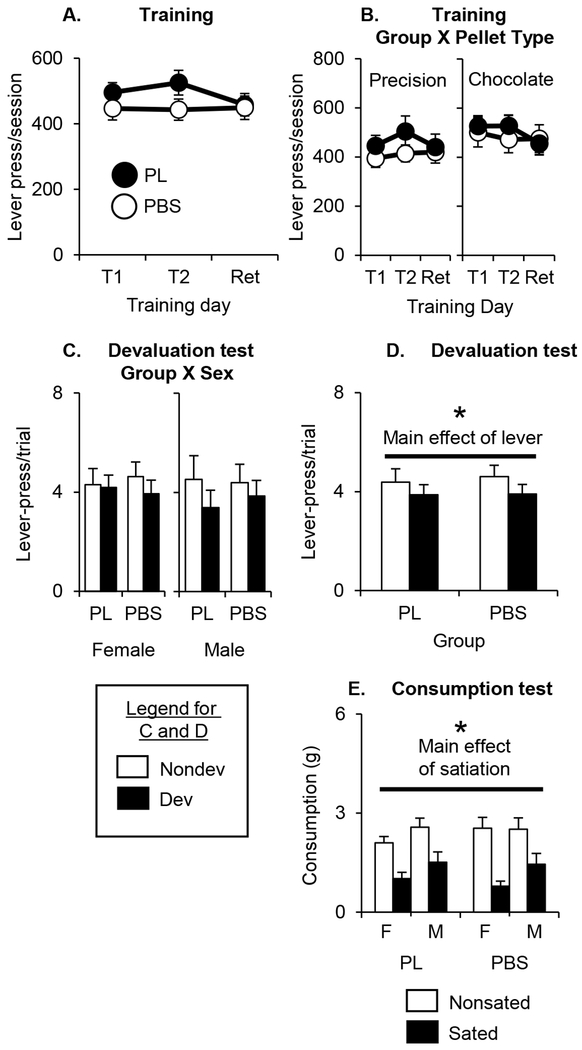
Figure 6:
A. Lever presses/session (mean ± SEM) during the first and second training cued-trial training days and retraining days for each pellet in Exp. 3 (averaged across sex and pellet type). B. Lever presses/session (mean ± SEM) during the first and second training cued-trial training days and retraining days for each pellet in Exp. 3 (averaged across sex and separated by pellet type). Left panel represents responding for precision pellets. Right panel represents responding for chocolate-flavored sucrose pellets. For A and B: Black circles represent rats that received PL inactivations. White circles represent rats that received PBS infusions. T1 and T2 represent the first and second day of cued trial training for each pellet type and Ret represents the retraining day for each pellet type (averaged across the first, second and retraining day for each pellet in A and presented separately for each pellet on in B). C. Lever presses/trial (mean ± SEM) during the devaluation test in Exp. 3 (averaged across trial and separated by sex). Left panel represents female responses. Right panel represents male responses. D. Lever presses/trial (mean ± SEM) during the devaluation test session in Exp. 3 (averaged across sex and trial). For C and D: White bars represent responding on the nondevalued lever. Black bars represent responding on the devalued lever. Nondev = nondevalued lever. Dev = devalued lever. E. Consumption in grams (mean ± SEM) of the sated and nonsated pellet types during the consumption test in Exp. 3 (averaged across sex). White bars = nonsated pellet type. Black bars = sated pellet type. F = female. M = male. * = p<0.05.

