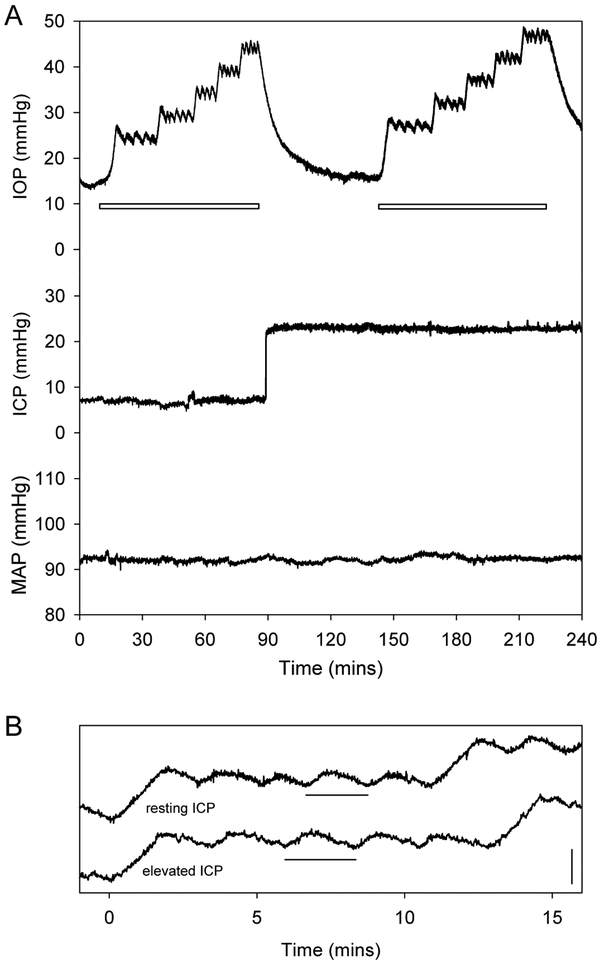
Figure 2.
IOP, ICP, and MAP records. A, Representative raw pressure data collected from an anesthetized rat before and after raising ICP by 15 mmHg. White bars indicate periods during which C was estimated by measuring the average pump duty cycle (i.e., flow rate) required to hold IOP at 10, 15, 20, 25, and 30 mmHg above its resting level. IOP, ICP, and MAP were 14.2 ± 0.4, 7.2 ± 0.3, and 92 ± 1 mmHg at rest, respectively, for this animal. B, IOP records for the +25 mmHg holding level in A shown on an expanded time scale. The records were displaced vertically and aligned to the same start time in order to facilitate visualization of the change in pump cycle duration (horizontal bars) before and after ICP elevation. Vertical bar is 5 mmHg in height.

