Figure 4.
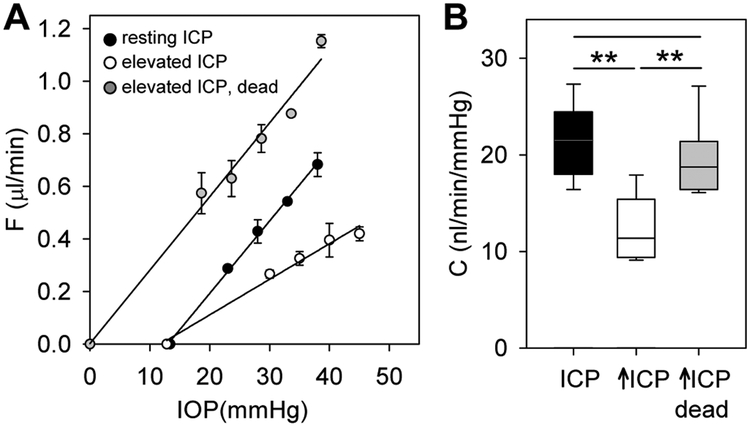
ICP effect involves an active physiological process. A, Pressure-flow data of a rat eye at resting ICP (black symbols), 15 mmHg above resting ICP (white symbols), and 15 mmHg above resting ICP after animal euthanasia (gray symbols). Data regression fits (lines) estimate C of 27 [21-33], 13 [11-16], and 27 [22-32] nl/min/mmHg, respectively. B. Summary of C data for the subset of animals tested pre- and post-euthanasia (n = 10). Box-and-whiskers plot median, 10th, 25th, 75th, and 90th percentiles. Error bars give standard deviations, and asterisks indicate statistically significant differences (p < 0.001).

