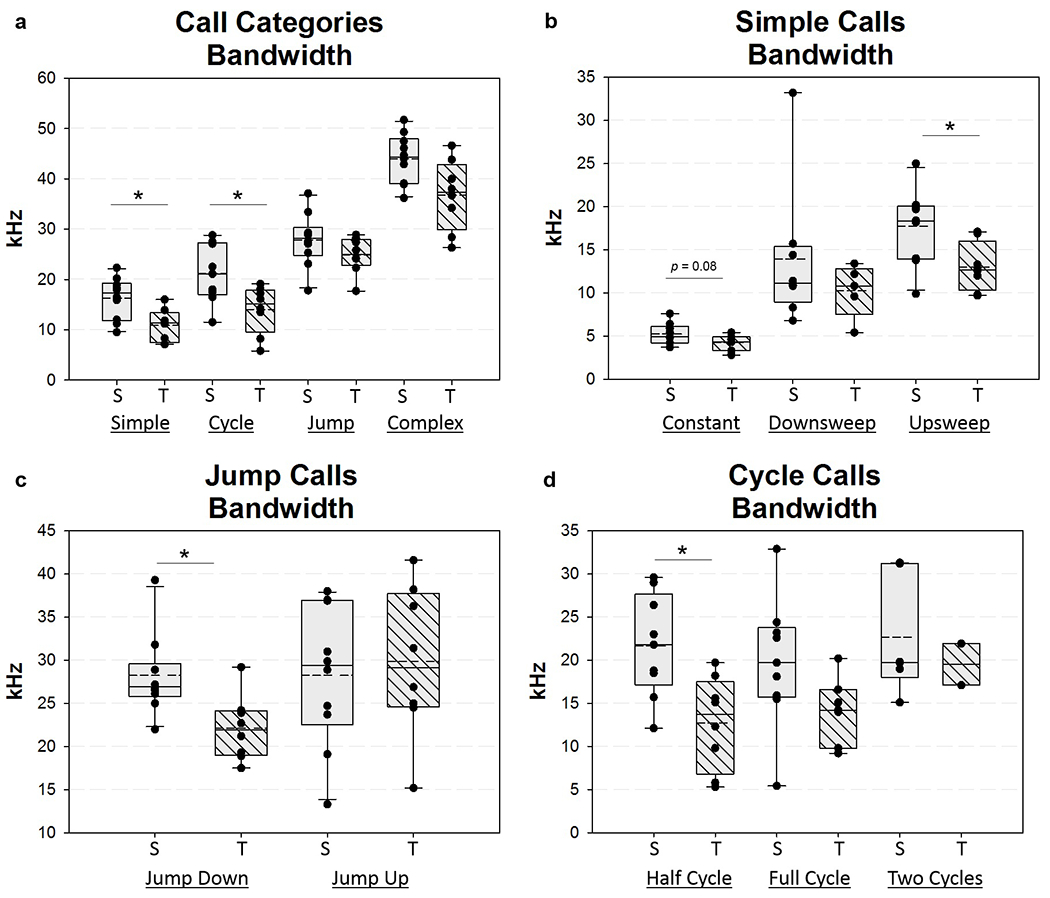
Figure 12.

Ultrasonic vocalization call bandwidth at 1 WPS. Box and whisker plots showing call bandwidth at 1 WPS for a) call categories, b) simple calls, c) jump calls, and d) cycle calls. Solid horizontal line = median, dashed horizontal line = mean, WPS = Weeks Post-Surgery; S = Sham, T = Transection, Asterisk (*) indicates significant difference between the two groups = p <0.05
