
Figure 13.
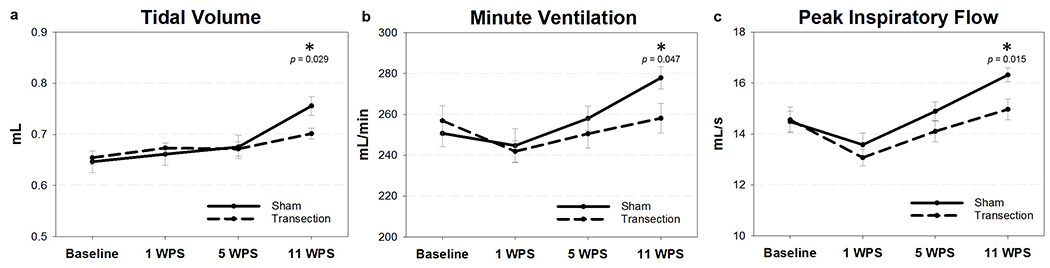
Respiratory parameters during hypercapnic/hypoxic conditions. After normoxic conditions, mice were exposed to a hypercapnic (7% CO2)/hypoxic (10.5% O2) challenge to induce increased respiratory effort. There was a significant difference between groups at 11 WPS for (a) tidal volume, (b) minute ventilation, and (c) peak inspiratory flow. WPS = weeks post-surgery; mL = milliliters; s = seconds; * = significant p value (p <0.05). Error bars = standard error.