Figure 3.

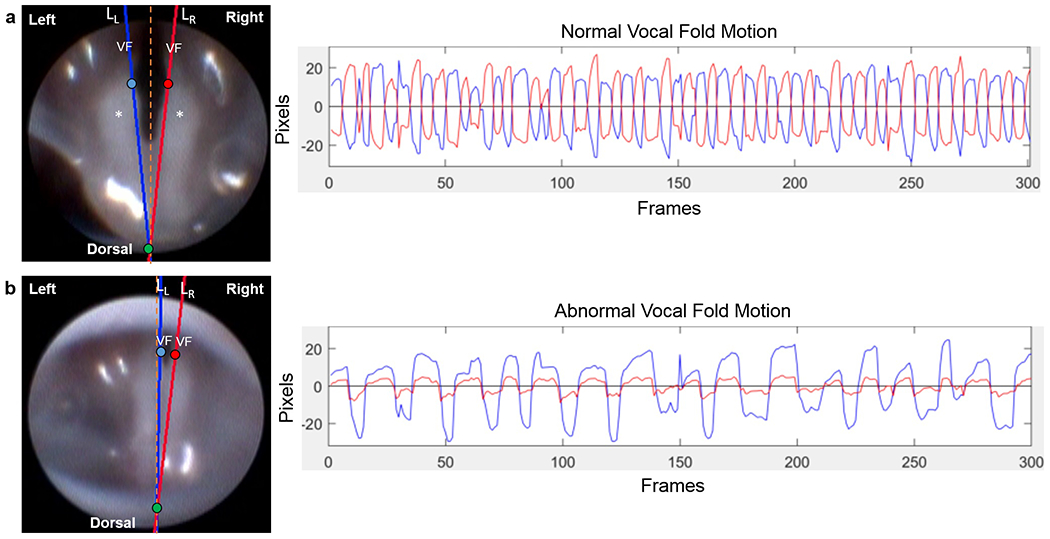
Representative still frame images (left) and displacement plots (right) of normal versus abnormal (paradoxical) vocal fold motion. On the first frame of each endoscopic video clip, two points, pL (blue circle) and pR (red circle), were manually placed on the medial aspect of each VF and associated arytenoid cartilage, and a third point, po (green circle), was placed midline, dorsal to the arytenoid cartilages. Using these manual reference points, separate lines (LL and LR) were automatically drawn to approximate the medial edge of each VF/arytenoid for motion tracking analysis, after automatic adjustment to make points pL and pR at the same fixed distance from po. These still frame images represent the positioning of the VFs in a state of maximum adduction. Note the left and right VF are symmetrical and do not cross the glottal midline in normal VF motion (a). However, in abnormal cases (b), the left VF may cross the glottal midline and contact the right VF, pushing it laterally, such that both VFs are paradoxically moving in the same direction. Alternatively, the left VF may pull the right VF medially during abduction, resulting in a similarly positive correlated displacement plot. VF = vocal fold. Asterisk (*) = arytenoid cartilage. Orange dashed line = glottal midline. Plots show displacement of the intact left (blue) VF and denervated right (red) VF with respect to their motion midline (0 on y-axis) over time. Normal VF motion (a) is represented by oscillatory motion of both VFs in opposite directions (negatively correlated). Abnormal (paradoxical) VF motion (b) is represented by movement of the VFs in the same direction (positively correlated).
