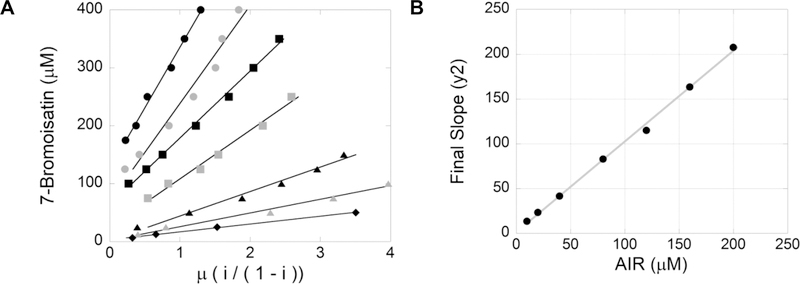
Figure 7.
Determination of the substrate depletion mechanism. (A) Plot of inhibitor, 7-bromoisatin (μM), vs μ, fractional inhibition, of the ATP-NADH coupled assay with various concentrations of AIR: 200 (black circles), 160 (gray circles), 120 (black squares), 80 (gray squares), 40 (black triangles), 20 (gray triangles), and 10 μM (black diamonds) from top to bottom, respectively. (B) Plot of the final slope (y2) from panel A vs AIR (μM).

