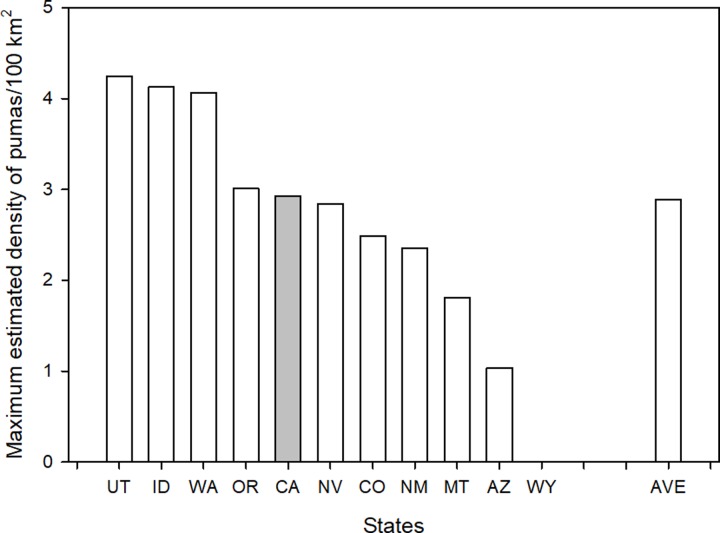
Fig 2. Maximum estimated density of puma (animals/100 km2) in 2003 for 9 of the western states with a sport hunt of puma (no estimate was available for Wyoming) and California (dark column).
Estimates are based on data provided by agencies in Becker et al. (2003) and agency reported amounts of puma habitat within their boundaries. States are identified by their standard two-letter postal codes. The final column (AVE) is the average for the 9 states that have a sport hunt of puma.

