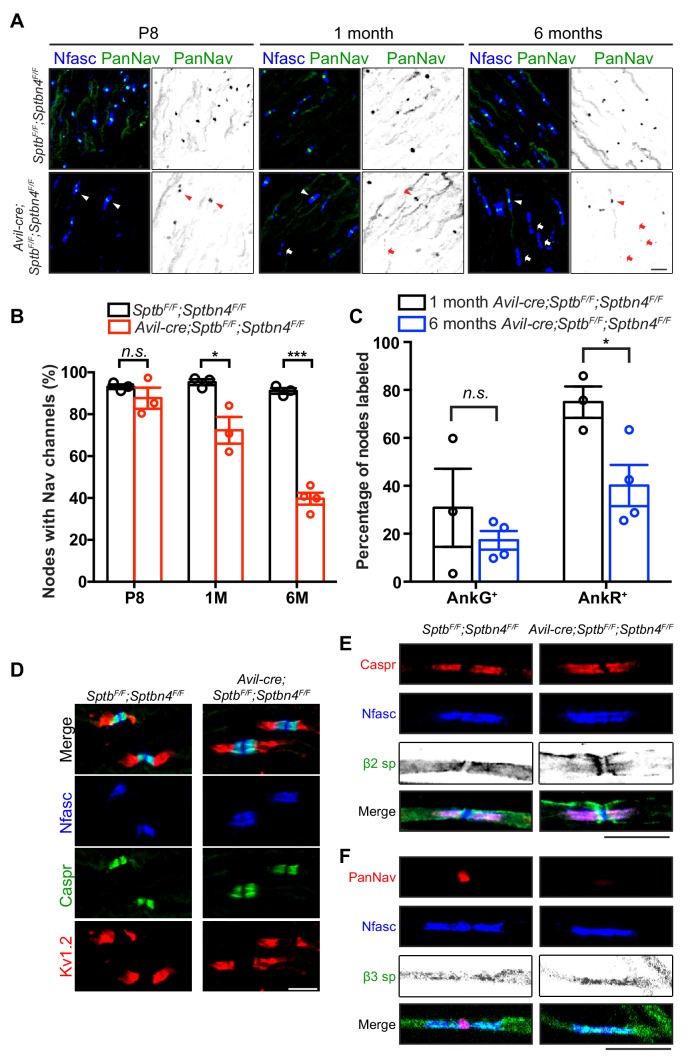
Figure 5. Mice lacking both β1 and β4 spectrin in PNS sensory neurons progressively lose their nodal Nav channels.
(A) Immunostaining of dorsal roots from P8, 1 month-old and 6 month-old SptbF/F;Sptbn4F/F and Avil-cre;SptbF/F;Sptbn4F/F mice using antibodies against pan-neurofascin (blue) and panNav channels (green). Arrowheads point to intact nodal Nav clusters, whereas arrows point to nodes devoid of Nav channels. Scale bar, 10 μm. (B) Quantification of the percentage of dorsal root nodes labeled for Nav channels in SptbF/F;Sptbn4F/F and Avil-cre;SptbF/F;Sptbn4F/F mice at the indicated ages. N = 3 animals per genotype per time point, except N = 4 in 6 month-old Avil-cre;SptbF/F;Sptbn4F/F. Data are mean ± SEM. P8: p=0.3508; 1M: *p=0.0249; 6M:***p=2.8444E-05. (C) The percentage of nodes labeled for AnkG or AnkR at 1 month or 6 months of age in Avil-cre;SptbF/F;Sptbn4F/F mice. N = 3 or four animals per genotype per timepoint, with a minimum of 80 nodes analyzed per animal. Data are mean ± SEM, *p=0.0296. (D) Immunostaining of dorsal roots from 6 month-old SptbF/F;Sptbn4F/F and Avil-cre;SptbF/F;Sptbn4F/F mice using antibodies against pan-neurofascin (blue), caspr (green), and Kv1.2 (red). Scale bar, 10 μm. (E) Immunostaining of teased dorsal roots from 9 month-old SptbF/F;Sptbn4F/F and Avil-cre;SptbF/F;Sptbn4F/F mice using antibodies against pan-neurofascin (blue), β2 spectrin (green), and caspr (red). Scale bar, 10 μm. (F) Immunostaining of teased dorsal roots from 9 month-old SptbF/F;Sptbn4F/F and Avil-cre;SptbF/F;Sptbn4F/F mice using antibodies against pan-neurofascin (blue), β3 spectrin (green), and panNav channels (red). Scale bar, 10 μm.


