. 2020 Jan 23;9:e51002. doi: 10.7554/eLife.51002

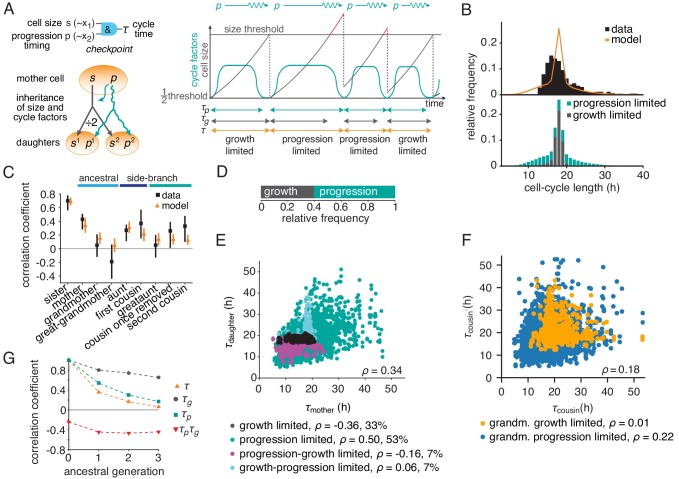
Figure 3. The growth-progression model.

(A) Scheme of the growth-progression model with heritable variables relating to cell size s and cycle progression timing p. (B) Measured and simulated cell-cycle length distributions (upper). Model distribution resolved by the division-limiting process (lower). (C) Measured and modeled correlation pattern with Spearman rank correlation coefficient and bootstrap 95%-confidence bounds. (D) Proportion of simulated cells limited by growth or progression. (E) Correlation of simulated mother-daughter cycle lengths colored by their division limitation: both by τg (black), both by τp (green), mother τp – daughter τg (magenta), mother τg – daughter τp (cyan). Percentage of cells in each subgroup and their correlation coefficients are shown. (F) Correlation of simulated cousin-cousin cycle length colored by the limitation of the common grandmother: by τg (orange) or τp (blue). (G) Autocorrelations along ancestral line of cycle length τ, growth time τg and the progression time τp, and the cross-correlation τpτg.

Figure 3—source data 1. Best-fit parameter values of the growth-progression model for all experiments shown, obtained from ABC-simulations.
Cell size was assumed to increase exponentially except for MYCN-inhibited cells, which were modelled by a logistic growth process with a fixed normalised maximum cell size smax equal to 20 times the threshold division size. The bottom two rows show the parameters used for simulated perturbations of growth cycle progression, respectively.

Figure 3.

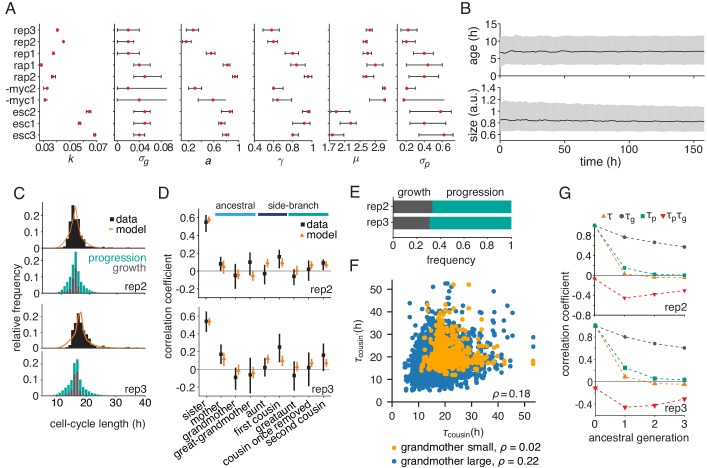
Figure 3—figure supplement 1. Parameterized growth-progression model generates long-range memory.

Figure 3—figure supplement 1.

(A) Best fit (red dot) and confidence bounds of the six model parameters fitted individually to each dataset by Approximate Bayesian Computation at a tolerance ϵ = 2. See Appendix 3 for details. (B) Simulated distributions of cell age and cell size over time showing median (black line) and interquartile range (gray). (C and D) Parameterized model fit to the experimental data, showing (C) the distribution of cycle length (upper) resolved by the division-limitation (lower) and (D) the correlation pattern with bootstrap 95%-confidence bounds. (E) Frequency of simulated cells limited by growth or progression showing the mean of 100 simulations using best-fit parameters. (F) Correlation of simulated cousin-cousin cycle length colored by the size common grandmother: smaller than the median value (orange) or larger (blue). (G) Best-fit predicted Spearman rank autocorrelations of the cycle length τ, the growth time τg and the progression time τp, and the cross-correlation τgτp.