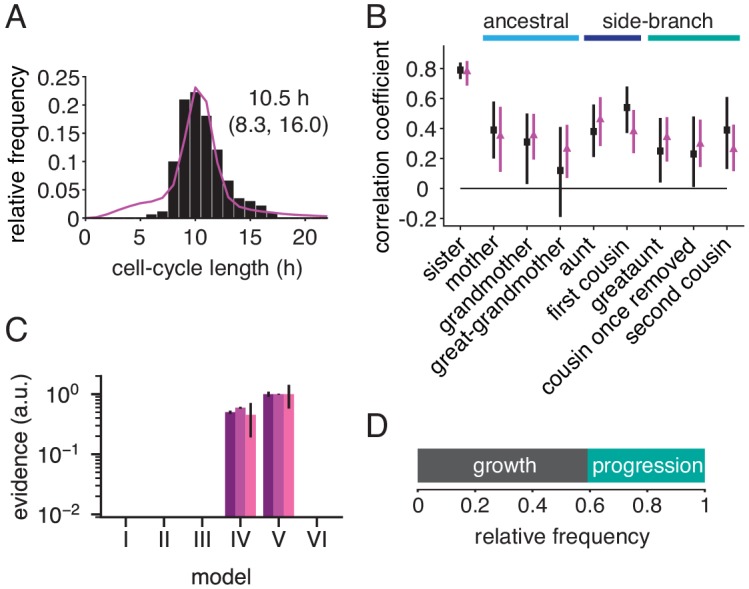
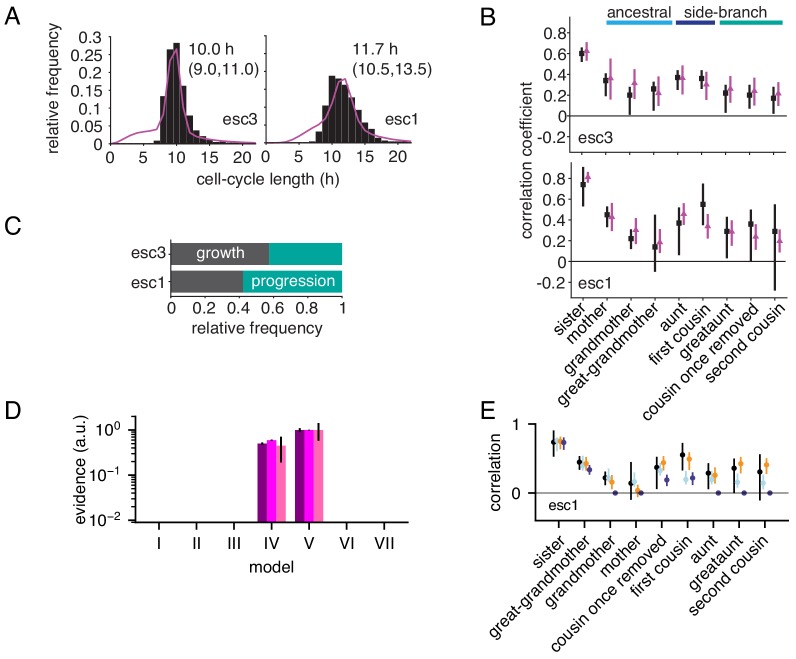
Figure 5. Rapid cell cycle of embryonic stem cells are frequently growth-limited.
(A) Cycle length distribution of data (black) and growth-progression model (purple). (B) Measured (black) and modeled (purple) correlation pattern using the growth-progression model. (C) Model evidences of the BAR model, version numbering as in Figure 2B. (D) Proportion of simulated cells limited by growth or progression. Data from Filipczyk et al. (2015) reanalyzed for cell-cycle duration.


