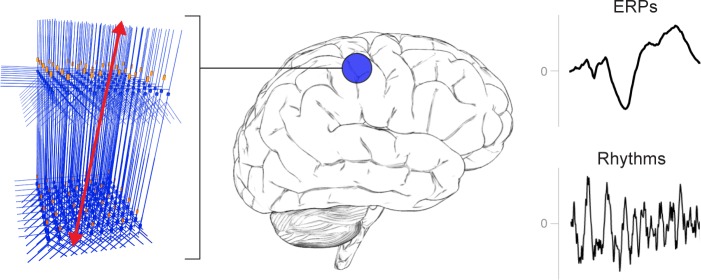
Figure 2. A schematic illustration of a canonical patch of neocortex that is represented by HNN’s underlying neural model.
(Left) 3D visualization of HNN’s model (pyramidal neurons drawn in blue, interneurons drawn in orange. (Right) Commonly measured EEG/MEG signals (ERPs and low frequency rhythms) from a single brain area that can be studied with HNN.

