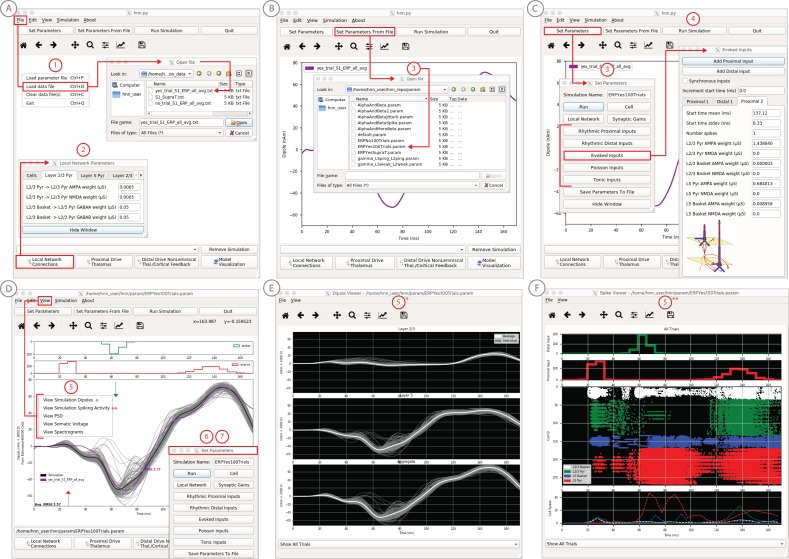
Figure 4. An example workflow showing how HNN can be used to link the macroscale current dipole signal to the underlying cell and circuit activity.
The example shown is for a perceptual threshold level tactile evoked response (50% detected) from SI (Jones et al., 2007; see ERP Tutorial text for details). (A) Steps 1 and 2: load data and define the local network structure. (B) Step 3: activate the local network, starting with a predefined parameter set; shown here for the parameter set for perceptual threshold-level evoked response (ERPYes100Trials.param) (C) Step 3 and 4: adjust the evoked input parameters according to user defined hypotheses and simulation experiment, and run the simulation. (D) Step 5: visualize model output; the net current dipole will be displayed in the main GUI window and microcircuit details, including layer-specific responses, cell membrane voltages, and spiking profiles (E and F) are shown by choosing them from the View pull down menu. Parameters can be adjusted to hypothesized circuit changes under different experimental conditions (e.g. see Figure 5).


