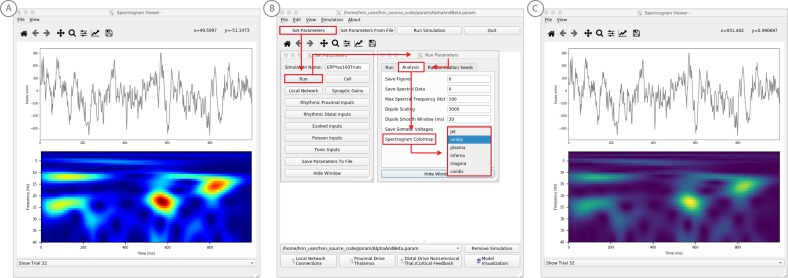
Figure 6. Example spontaneous data from a current dipole source in SI showing transient alpha (~7–14 Hz Hz) and beta (~15–29 Hz) components (data as in Jones et al., 2009).
The data file (‘SI_ongoing.txt’) used to generate these outputs is provided with HNN and plotted through the ‘View → View Spectrograms’ menu item, followed by ‘Load Data’, and then selecting the file. (A) The spectrogram viewer with the default ‘jet’ colormap. (B) The configuration option to change the colormap to other perceptually uniform colormaps, where the lightness value increases monotonically. (C) The spectrogram viewer updated with the perceptually uniform ‘viridis’ colormap.

