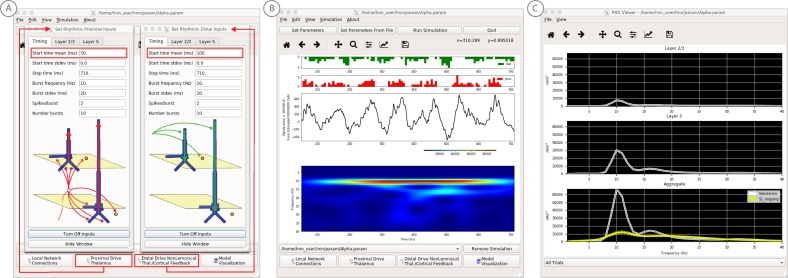
Figure 7. An example workflow for simulating alpha frequency rhythm (Jones et al., 2009; Ziegler et al., 2010; see Alpha and Beta Rhythms Tutorial text for details).
(A) Here we are using the default HNN network configuration and not directly comparing the waveform to data, so begin with Step 3: activate the local network. Motivated by prior studies (see text), in this example alpha rhythms were simulated by driving the network with ~10 Hz bursts (presumed to be generated by thalamus) to the local network through proximal and distal projection pathways. The parameter set describing these burst is provided in the Alpha.param file and loaded through the Set Parameters From File button. Adjustable burst drive parameter are shown and here were set with a 50 ms delay between the ~10 proximal and distal drive (red boxes). (B) Step 4: running the simulation with the ‘Run Simulation’ button, shows that a continuous alpha rhythm emerged in the current dipole signal (middle dipole time trace; bottom time-frequency representation). Green and red histograms at the top display the defined distal and proximal burst drive patterns, respectively. (C) Step 5: additional network features, including layer specific power spectral density plots as shown can be visualized through the ‘View’ pull down menu, and compared to data (here compared to the spontaneous SI data shown in Figure 6A). Features of the burst drive can be adjusted (panel A) and corresponding changes in the current dipole signals studied (Steps 6 and 7, see Figure 8).

