Figure 4. Conformational gradient in the GTP cap revealed by spatially resolved single EB3 dwell time distributions.
(a) TIRF microscopy kymograph of single mGFP-EB3 molecules (green) at 25 pM in the plus end region of an E254D microtubule (E254D MT) growing at 10 µM E254D tubulin (vg = 58.5 nm/s) in the additional presence of 1 nM Alexa647-EB3 (magenta) (for end region visualization). (b) Dwell time distribution of single mGFP-EB3 molecules plotted as a survival function (1- CDF, cumulative density function). Number of microtubules analyzed - 150, number of mGFP-EB3 binding events - 1834. (c) Local dwell time distributions at distinct distances from the growing microtubule plus end. Dashed magenta lines are mono-exponential fits. The distance bins are 0–0.59, 1.18–1.77 and 3.84–5.02 µm; bin centers shown in the legend. Experimental data as in (b). (d) Local mean EB3 dwell times as a function of distance from the growing E254D microtubule end. Filled symbols correspond to the local mean dwell times calculated based on data in (c). The solid magenta line is a mono-exponential fit with a decay length of 850 nm. (e) TIRF microscopy kymograph of single mGFP-EB3 molecules (green) at 25 pM in the plus end region of a wildtype (WT) microtubule growing at 19 µM wildtype tubulin (vg = 59.8 nm/s) in the presence of additional 1 nM Alexa647-EB3 (magenta). (f) mGFP-EB3 dwell time distribution. Number of microtubules analyzed - 548, number of mGFP-EB3 binding events - 2425. (g) Local mGFP-EB3 dwell time distributions. Dashed cyan lines are mono-exponential fits. Experimental data as in (f). (h) Local mean EB3 dwell times in the wildtype microtubule plus end region. Filled symbols correspond to the local mean dwell times calculated based on data in (g). The solid cyan line is a mono-exponential fit to the data with a decay length of 450 nm. (i) Schematic of high affinity EB3 binding to the GTP lattice of a GTPase-deficient microtubule. (j) Schematic of a growing end of a GTPase-competent microtubule displaying a gradually decreasing EB3 binding affinity (illustrated by a color gradient) as the lattice conformation changes as a consequence of GTP hydrolysis.

Figure 4—figure supplement 1. Flow chart of single molecule localization and spatially-resolved dwell time analysis.

Figure 4—figure supplement 2. Spatially-resolved EB3 dwell time distributions at the ends of E254D and wildtype microtubules.

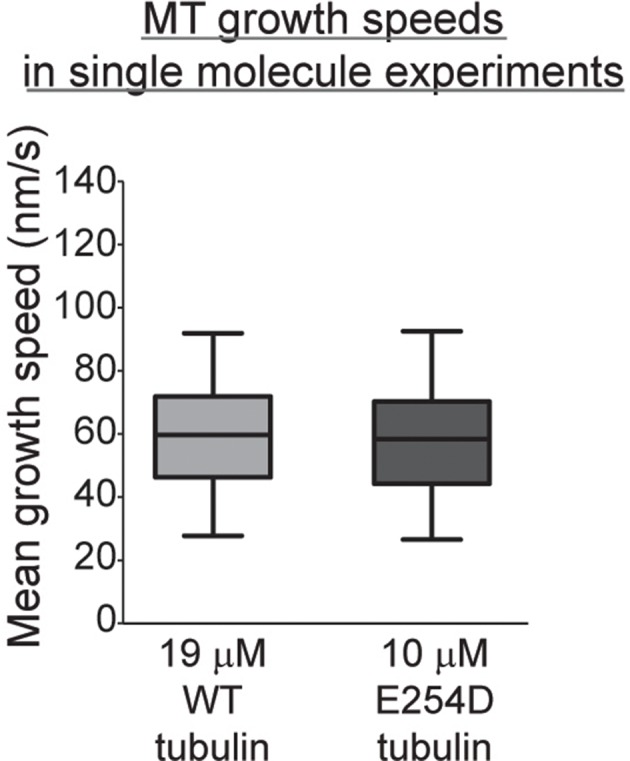
Figure 4—figure supplement 3. Wildtype and E254D microtubules grow with similar speeds under single molecule experiment conditions.