. 2020 Jan 30;9:e53243. doi: 10.7554/eLife.53243

Figure 2. Electron microscopy of uninhibited IMPDH2 filaments.

(A) Negative stain EM of purified human IMPDH2. Treatment with 1 μM ATP induces filament assembly. Scale bar 100 nm. (B) Representative 2D class averages from the 2.5 mM ATP cryo-EM dataset. (C) Negative stain EM of actively catalyzing IMPDH2 (2 mM IMP, 2 mM NAD+), with and without 2 mM ATP. (D) Initial velocity of enzyme (2 mM IMP, 2 mM NAD+), with and without 2 mM ATP. Average of three replicates, error bars + /- 1 s.D. (E–G) Representative 2D class averages from the three uninhibited enzyme cryo-EM datasets, with nucleotide concentrations as indicated at bottom.

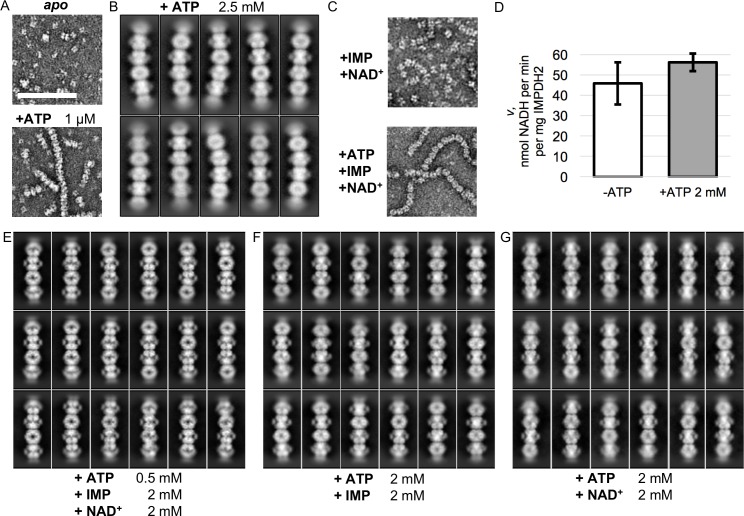
Figure 2.

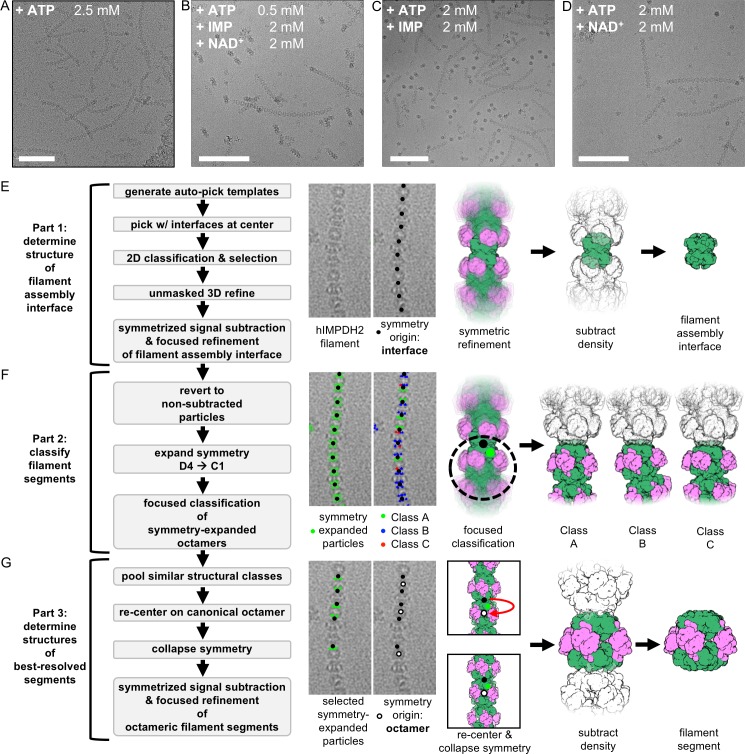
Figure 2—figure supplement 1. A cryo-EM image processing workflow for structure determination of flexible IMPDH2 filaments.

Figure 2—figure supplement 1.

(A-D) Representative cryo-EM micrographs of IMPDH2 treated with 2.5 mM ATP (A), 0.5 mM ATP, 2 mM IMP, and 2 mM NAD+ (B), 2 mM ATP and 2 mM IMP (C), or 2 mM ATP and 2 mM NAD+ (D). Full datasets contained 480, 2169, 2289, and 2178 micrographs, respectively. Scale bars 100 nm. (E) Template-based picking, unmasked refinement, density subtraction, and masked refinement results in a reconstruction of the eight symmetrically arranged catalytic domains that make up the filament assembly interface. (F) Reverting to the un-subtracted particles, expanding the D4 symmetry, and classifying without alignment using a mask including a single filament segment identifies different segment conformations. (G) The best resolved map of each filament segment class was obtained by pooling similar classes, re-extracting and re-centering the refinement from the assembly interface onto to the canonical octamer, collapsing the symmetry expansion by deleting all Euler angle priors and removing overlapping particles, and re-refining from scratch, with additional classification and application of point-group symmetry resulting in further improvements in resolution.
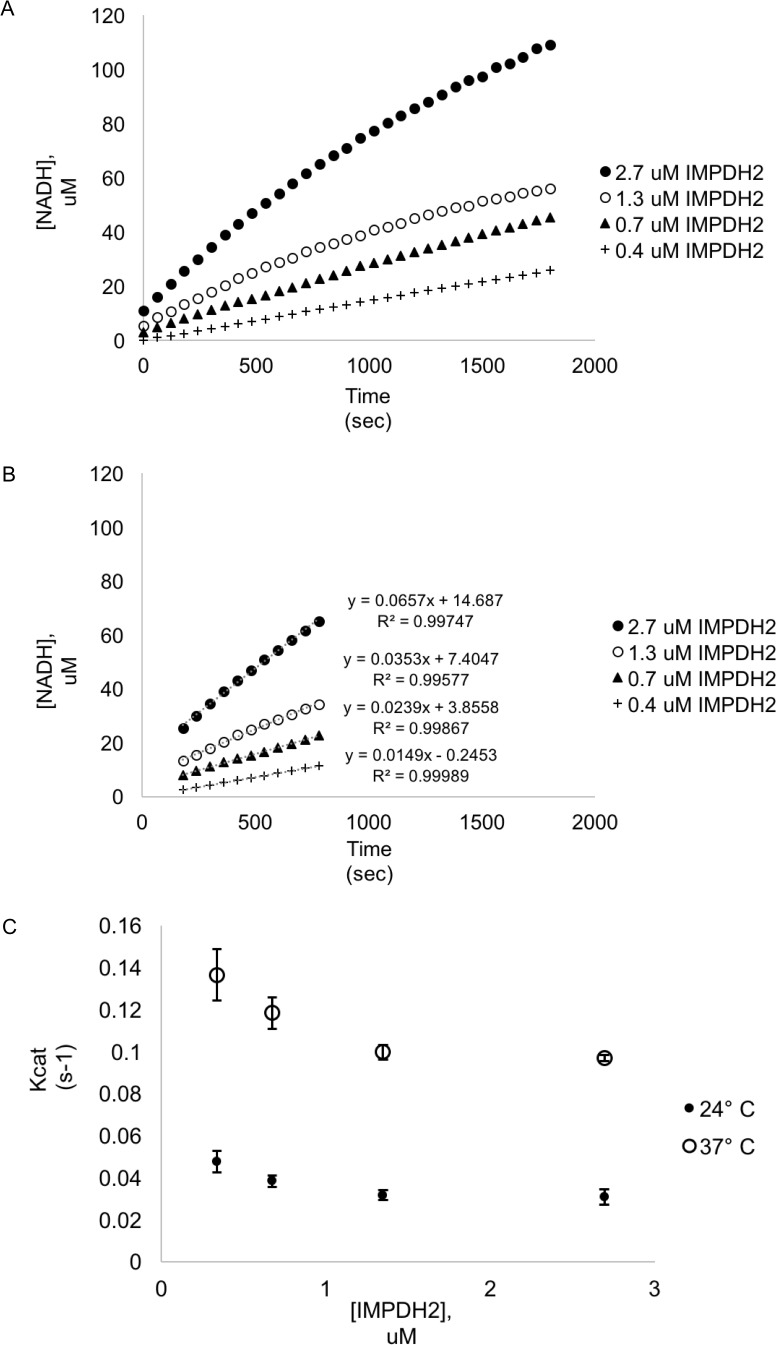
Figure 2—figure supplement 2. Kinetic data of IMPDH2.

Figure 2—figure supplement 2.

(A) Example spectrophotomer trajectories from IMPDH2 kinetic assays at different protein concentrations (1 mM NAD+, 1 mM IMP). (B) The same curves from A), showing only the range used to calculate reaction rates (3 min to 8 min after reaction start), as well as linear fits. (C) Experimental values for Kcat at either 24 or 37 degrees Celsius, for different enzyme concentrations (three replicates, error bars +/1 1 s.D.).