. 2020 Jan 30;9:e53243. doi: 10.7554/eLife.53243

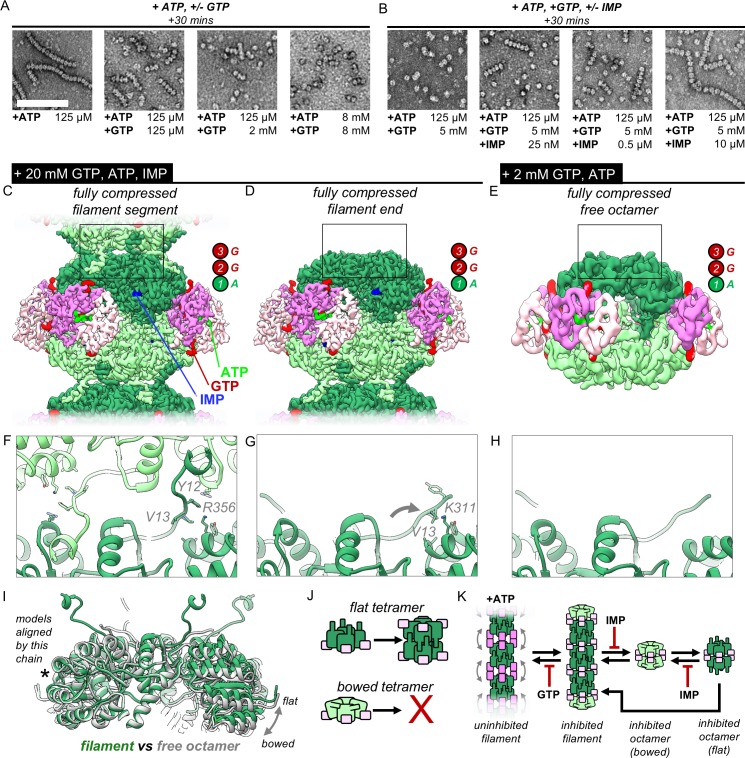
Figure 4. IMP and GTP allosterically modulate filament assembly and disassembly.

(A) Roughly 2 mM GTP inhibits filament assembly of IMPDH by ATP. Negative stain EM, protein concentration 2 uM. Scale bar 100 nm. Final nucleotide concentrations for each EM grid were as indicated below each image. (B) Roughly 10 uM IMP inhibits filament assembly by GTP. Final nucleotide concentrations for each EM grid were as indicated below each image. (C) Composite cryo-EM density of the GTP/ATP/IMP filament assembly interface and fully compressed filament segment maps (20 mM GTP, 0.5 mM ATP, 1 mM IMP). (D) Cryo-EM density of the fully compressed filament end map. (E) Cryo-EM density of the GTP/ATP non-filament fully compressed free octamer map (2 mM GTP, 2 mM ATP). (F–H) Close-up ribbon views of the assembled and unassembled filament interfaces the maps in A-C. (I) Comparison between the tetramer conformations of the ‘flat’ assembled filament interface (green) and the ‘bowed’ unassembled free octamer (gray). (J) Cartoon of the relationship between tetramer bowing and filament assembly. (K) Model of the regulation of filament assembly by GTP and IMP.

Figure 4—source data 1. Statistics of cryo-EM data collection, reconstruction and model refinement for the ATP, 2 mM GTP dataset.
Figure 4—source data 2. Statistics of cryo-EM data collection, reconstruction and model refinement for the ATP/IMP, 20 mM GTP dataset.

Figure 4.

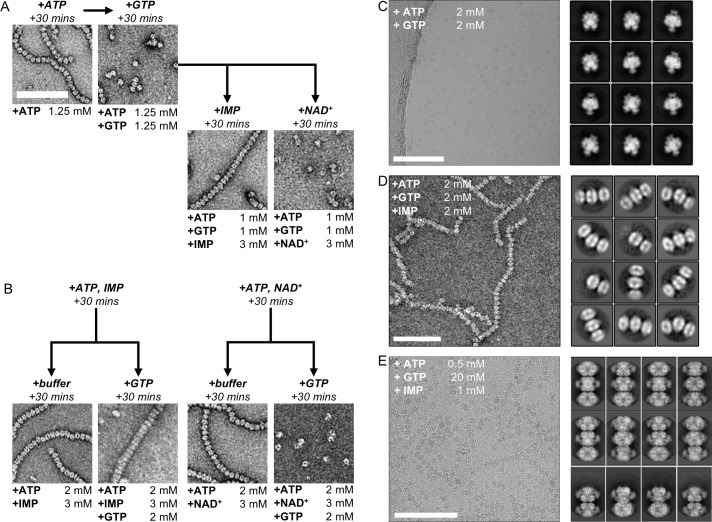
Figure 4—figure supplement 1. Electron microscopy of human IMPDH2 treated with ATP, GTP, IMP, and NAD+.

Figure 4—figure supplement 1.

(A) IMP, but not NAD+, promotes re-assembly of GTP-disassembled filaments. Reagents added sequentially, with 30 min room-temperature incubation steps between. Final nucleotide concentrations for each EM grid were as indicated below each image. (B) IMP, but not NAD+, protects against disassembly of filaments by GTP. Reagents added sequentially, with 30 min room-temperature incubation steps between. Final nucleotide concentrations for each EM grid were as indicated below each image. (C) Cryo-EM of IMPDH2 treated with 2 mM ATP and 2 mM GTP. Representative micrograph (of 1159) and 2D class averages. (D) Negative stain EM of IMPDH2 treated with 2 mM ATP, 2 mM IMP, and 2 mM GTP. Representative micrograph and 2D class averages. (E) Cryo-EM of IMPDH2 treated with 0.5 mM ATP, 20 mM GTP and 1 mM IMP. Representative micrograph (of 2248), and 2D class averages. All scale bars 100 nm.
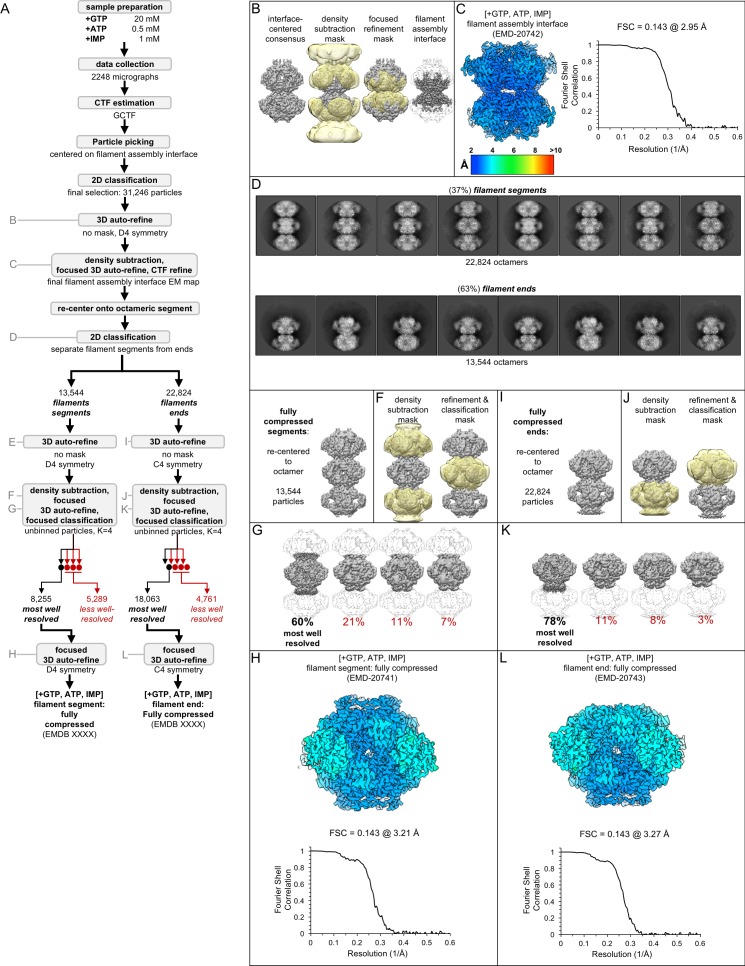
Figure 4—figure supplement 2. Image processing of the IMPDH2 +ATP, IMP, 20 mM GTP cryo-EM dataset.

Figure 4—figure supplement 2.

Nucleotide concentrations for this dataset: 20 mM GTP, 0.5 mM ATP and 1 mM IMP. (A) Flow chart summarizing data processing strategy. (B) Density subtraction and focused refinement of the consensus filament assembly interface. (C) Local resolution estimation and FSC curve (via relion postprocessing) for the ATP/IMP/[20 mM]GTP consensus filament assembly interface. (D) 2D classification to separate filament segments and filament ends. Representative 2D class averages. (E) Unmasked refinement from all fully compressed segments, pooled and recentered. (F) Masks used for continued processing of fully compressed segments. (G) Final classification of the best-resolved fully compressed filament segment class H) Local resolution estimation and FSC curve for the ATP/IMP/[20 mM]GTP fully compressed filament segment I-L) Same as E-H, but for the best-resolved ATP/IMP/[20 mM]GTP filament end.
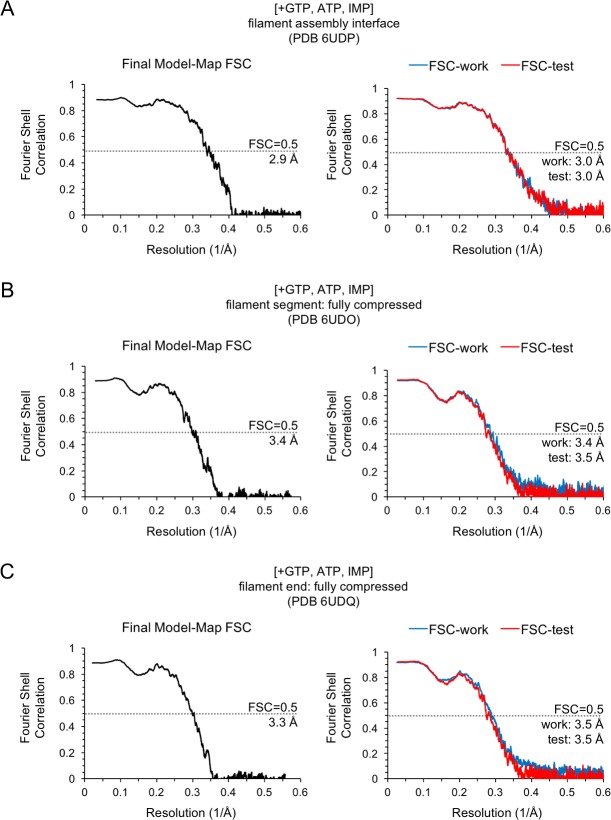
Figure 4—figure supplement 3. Model/Map FSC curves for the IMPDH2 +ATP, IMP, 20 mM GTP cryo-EM dataset.

Figure 4—figure supplement 3.

Nucleotide concentrations for this dataset: 20 mM GTP, 0.5 mM ATP and 1 mM IMP. For each structure, model/map Fourier shell correlations were calculated between the final map and model (left), as well as between a model refined against half-map 1 and either half-map 1 (FSC-work) or half-map 2 (FSC-test) (right). (A) Final model/map FSC curves for the for the ATP/IMP/[20 mM]GTP consensus filament assembly interface. (B) Final model/map FSC curves for the ATP/IMP/[20 mM]GTP fully compressed filament segment. (C) Final model/map FSC curves for the ATP/IMP/[20 mM]GTP filament end.
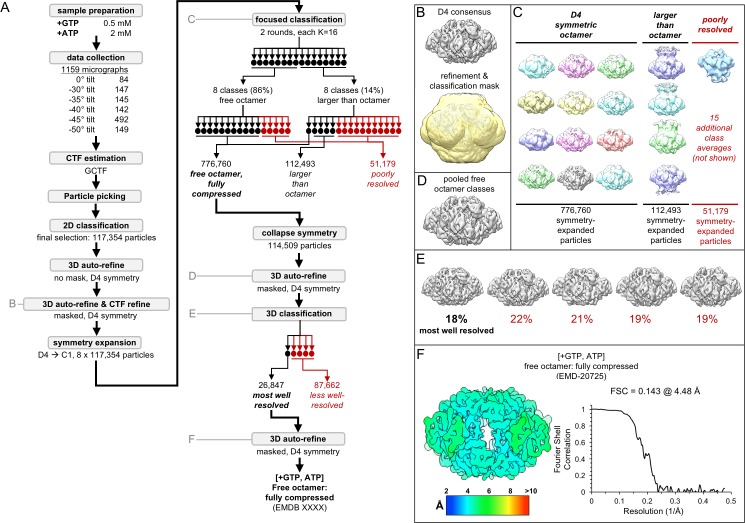
Figure 4—figure supplement 4. Image processing of the IMPDH2 +ATP, 2 mM GTP cryo-EM dataset.

Figure 4—figure supplement 4.

Nucleotide concentrations for this dataset: 2 mM GTP and 2 mM ATP. (A) Flow chart summarizing data processing strategy. (B) Masked 3D refinement and all particles from 2D classification/refinement consensus filament assembly interface. Mask also used for all further processing. D4 symmetry enforced during refinement. (C) Final class averages from symmetry expanded classification of free octamers. (D) Masked refinement from all fully compressed free octamers. (E) Final classification of the best-resolved fully compressed free octamers H) Local resolution estimation and FSC curve for the ATP/[2 mM]GTP fully compressed free octamer.
Figure 4—figure supplement 5. Model/Map FSC curves for the IMPDH2 +ATP, 2 mM GTP cryo-EM dataset.
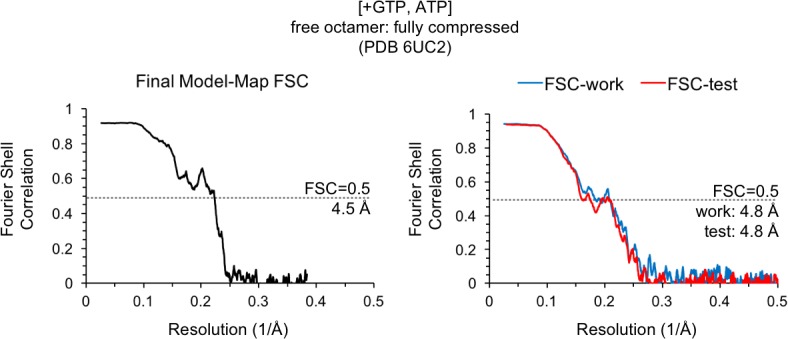
Figure 4—figure supplement 5.

Nucleotide concentrations for this dataset: 2 mM GTP and 2 mM ATP. Model/map Fourier shell correlations were calculated between the final map and model (left), as well as between a model refined against half-map 1 and either half-map 1 (FSC-work) or half-map 2 (FSC-test) (right).
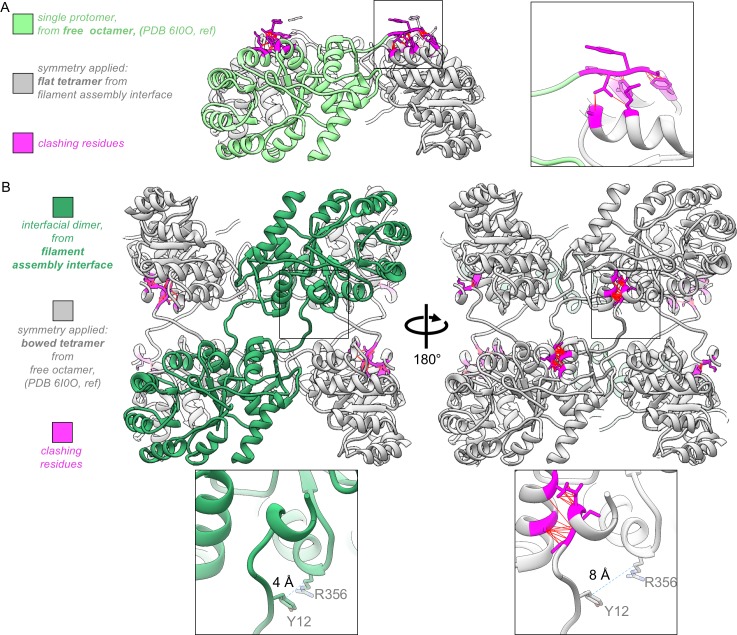
Figure 4—figure supplement 6. The assembled IMPDH2 filament interface is not compatible with the ‘bowed’ tetramer conformation seen in the unassembled GTP-bound free octamer.

Figure 4—figure supplement 6.

(A) The protomer from the +GTP crystal structure 6I0O (green), with applied symmetry from the filament assembly interface ‘flat’ tetramer (gray). N-terminus residues that now clash are colored magenta. Inset: closeup of clashing N-terminus. Red lines indicate specific steric clashes. (B) Two identical protomers of the filament assembly interface dimer (green) with applied symmetry from the ‘bowed’ tetramer of the +GTP crystal structure 6I0O (gray), with clashing residues colored magenta. Inset: tetramer bowing separates the key residues Y12 and R356 (distances shown are between the gamma carbons of the two residues, indicated by dotted blue line).