. 2020 Jan 30;9:e53243. doi: 10.7554/eLife.53243

Figure 5. IMPDH2 filaments resist GTP inhibition by promoting bent octamer conformations that separate opposing active sites.

(A) Negatively stained EM of uninhibited (left), partially inhibited (center), and fully inhibited (right) IMPDH2. Representative micrographs and reference free 2D class averages. Prepared with 1 mM IMP, 1 mM NAD+, and either 0, 2.5 mM, or 20 mM GTP. (B–C) NAD+ saturation curves of uninhibited WT IMPDH2 (solid line), and the non-assembly mutant Y12A (dashed line). Reactions performed with 0.5 mM ATP, 1 mM IMP, and varying NAD+. (C) NAD+ saturation curves of WT filaments treated with 0.5 mM ATP, 1 mM IMP, varying NAD+ and 2 mM GTP. (D) Six cryo-EM maps from two datasets (uninhibited ATP/IMP/NAD+ and partially inhibited ATP/IMP/NAD+/[2 mM]GTP) exhibiting a range of Bateman domain conformations. The uninhibited filaments were prepared with 0.5 mM ATP, 2 mM IMP, and 2 mM NAD+. The partially inhibited filaments were prepared with 0.5 mM ATP, 2 mM IMP, and 2 mM NAD+, and 2 mM GTP. (E) A view of a single tetramer from the inside of each octamer. The lighter colored tetramer from panel A is hidden, with the surface area buried between tetramer active sites colored in yellow, with the indicated total buried surface area. (F) Corresponding views of Bateman domain conformations. Protein displayed as ribbon, with the two interacting Bateman domains colored orchid and light pink. Cryo-EM density for non-protein ligand densities is colored green and red, for ATP and GTP, respectively. Symmetry identities labeled with gray letters. In the extended conformation, allosteric site 3 is distorted, and does not bind ligands (black dashes). Allosteric site 3 is formed in compressed protomers, but in the absence of guanine nucleotides it remains unoccupied (black asterisk). In the extended protomers of some bent octamers, is is possbile that allosteric site 2 is only partially occupied (black tilde).

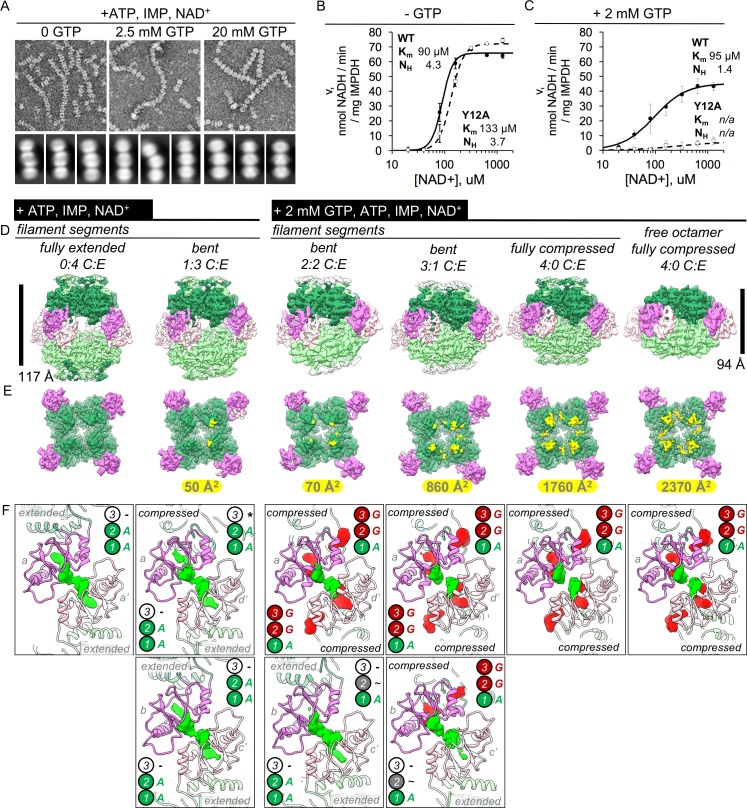
Figure 5—source data 1. Statistics of cryo-EM data collection, reconstruction and model refinement for the ATP/IMP/NAD+, 2 mM GTP dataset.

Figure 5.

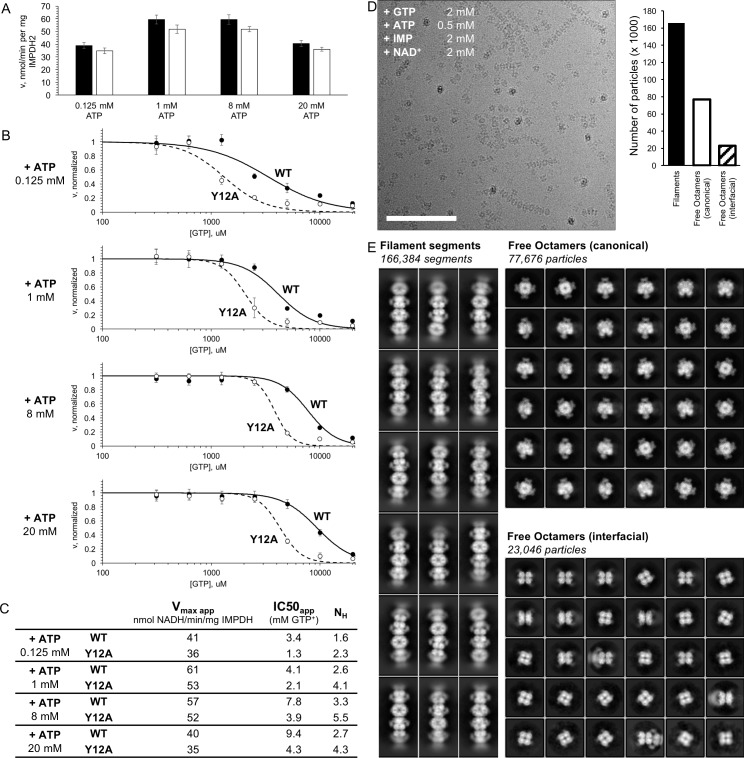
Figure 5—figure supplement 1. IMPDH2 filaments resist GTP inhibition.

Figure 5—figure supplement 1.

(A) Initial reaction rates for uninhibited WT enzyme and the filament non-assembly mutant Y12A under various ATP concentrations. High concentrations of ATP likely inhibit by competing with co-substrate NAD+. Reactions prepared using 2 mM IMP, 2 mM NAD+, and either 0.125, 1, 8, or 20 mM ATP. (B) Apparent GTP inhibition under saturating substrates for a range of ATP concentrations. Under all conditions, WT was more resistant to GTP inhibition than Y12A. Reactions prepared using 2 mM IMP, 2 mM NAD+, either 0.125, 1, 8, or 20 mM ATP, and varying GTP. (C) Estimated Hill equation parameters for data in panel B. (D) Cryo-EM of partially inhibited IMPDH2 filaments. Enzyme treated with 0.5 mM ATP, 2 mM IMP, 2 mM NAD+, and 2 mM GTP. Representative micrograph, 2944 total. Scale bar 100 nm. (E) Representative 2D class averages of ATP/IMP/NAD+/[2 mM]GTP cryo-EM dataset. Three particle types were observed: filament segments, canonical ‘face-to-face’ free octamers, and interfacial ‘back-to-back’ octamers.
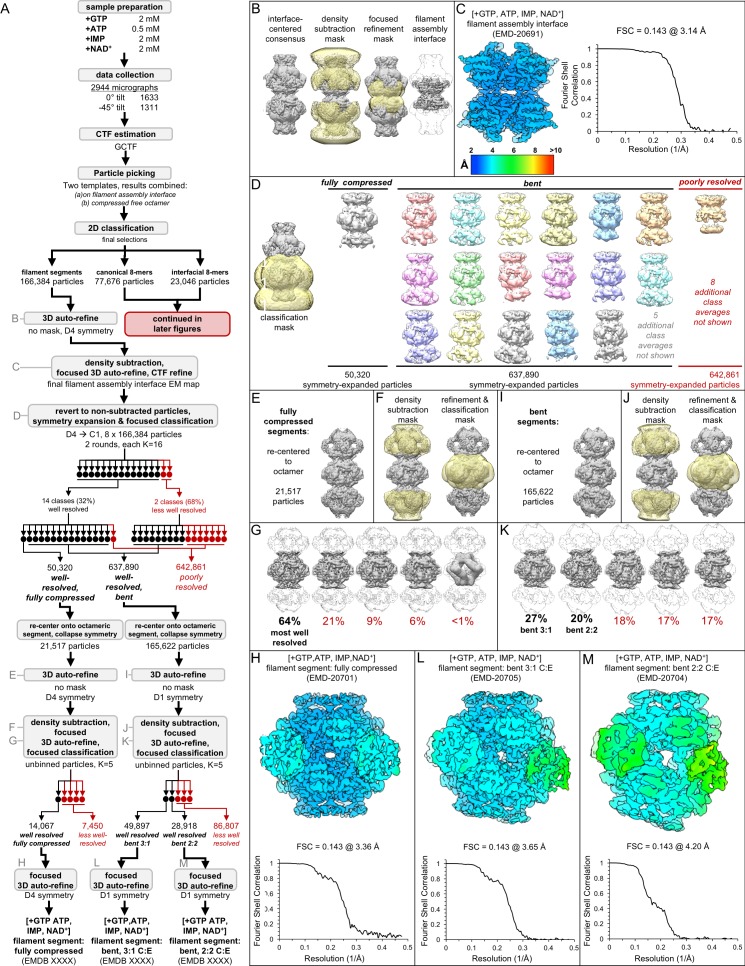
Figure 5—figure supplement 2. Image processing of the IMPDH2 +ATP, IMP, NAD+, 2 mM GTP cryo-EM dataset, part 1: initial processing, and processing of filament segments.

Figure 5—figure supplement 2.

Nucleotide concentrations for this dataset: 2 mM GTP, 0.5 mM ATP, 2 mM IMP, 2 mM NAD+. (A) Flow chart summarizing data processing strategy. (B) Density subtraction and focused refinement of the consensus filament assembly interface. (C) Local resolution estimation and FSC curve (via relion postprocessing) for the ATP/IMP/NAD+/[2 mM]GTP consensus filament assembly interface. (D) Final class averages from symmetry expanded classification of filament segments. (E) Unmasked refinement from all fully compressed segments, pooled and recentered. (F) Masks used for continued processing of fully compressed segments. (G) Final classification of the best-resolved fully compressed filament segment class H) Local resolution estimation and FSC curve for the ATP/IMP/NAD+/[2 mM]GTP fully compressed filament segment I-K) Same as E-G, but for the best-resolved ATP/IMP/NAD+/[2 mM]GTP bent filament segment. (L–M) Local resolution estimation and FSC curves for the two different ATP/IMP/NAD+/[2 mM]GTP bent filament segments.
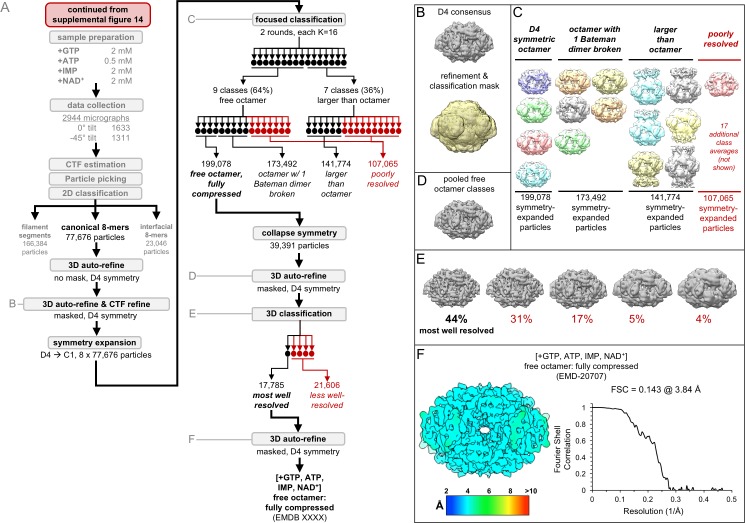
Figure 5—figure supplement 3. Image processing of the IMPDH2 +ATP, IMP, NAD+, 2 mM GTP cryo-EM dataset, part 2: the free canonical octamers.

Figure 5—figure supplement 3.

Nucleotide concentrations for this dataset: 2 mM GTP, 0.5 mM ATP, 2 mM IMP, 2 mM NAD+. (A) Flow chart summarizing data processing strategy. (B) Masked 3D refinement and all particles from 2D classification/refinement consensus filament assembly interface. Mask also used for all further processing. D4 symmetry enforced during refinement. (C) Final class averages from symmetry expanded classification of free octamers. (D) Masked refinement from all fully compressed free octamers. (E) Final classification of the best-resolved fully compressed free octamers H) Local resolution estimation and FSC curve for the ATP/IMP/NAD+/[2 mM]GTP fully compressed free canonical octamer.
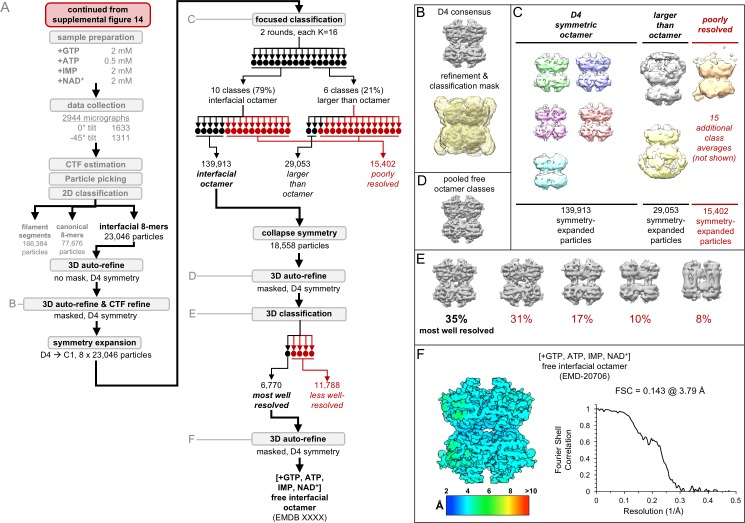
Figure 5—figure supplement 4. Image processing of the IMPDH2 +ATP, IMP, NAD+, 2 mM GTP cryo-EM dataset, part 3: the free interfacial octamers.

Figure 5—figure supplement 4.

Nucleotide concentrations for this dataset: 2 mM GTP, 0.5 mM ATP, 2 mM IMP, 2 mM NAD+. (A) Flow chart summarizing data processing strategy. (B) Masked 3D refinement and all particles from 2D classification/refinement consensus filament assembly interface. Mask also used for all further processing. D4 symmetry enforced during refinement. (C) Final class averages from symmetry expanded classification of free octamers. (D) Masked refinement from all fully compressed free octamers. (E) Final classification of the best-resolved fully compressed free octamers H) Local resolution estimation and FSC curve for the ATP/IMP/NAD+/[2 mM]GTP free interfacial octamer.
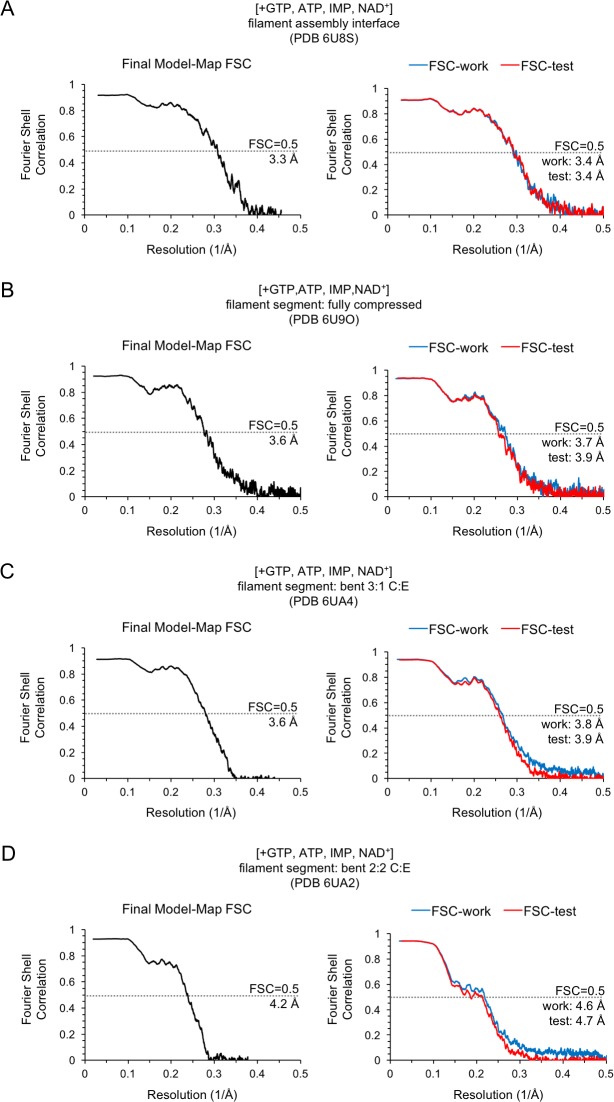
Figure 5—figure supplement 5. Model/Map FSC curves for the IMPDH2 +ATP, IMP, NAD+, 2 mM GTP cryo-EM dataset (filament structures).

Figure 5—figure supplement 5.

Nucleotide concentrations for this dataset: 2 mM GTP, 0.5 mM ATP, 2 mM IMP, 2 mM NAD+. For each structure, model/map Fourier shell correlations were calculated between the final map and model (left), as well as between a model refined against half-map 1 and either half-map 1 (FSC-work) or half-map 2 (FSC-test) (right). (A) Final model/map FSC curves for the for the ATP/IMP/NAD+/[2 mM]GTP consensus filament assembly interface. (B) Final model/map FSC curves for the ATP/IMP/NAD+/[2 mM]GTP fully compressed filament segment. (C–D) Final model/map FSC curves for the ATP/IMP/NAD+/[2 mM]GTP bent filament segments.
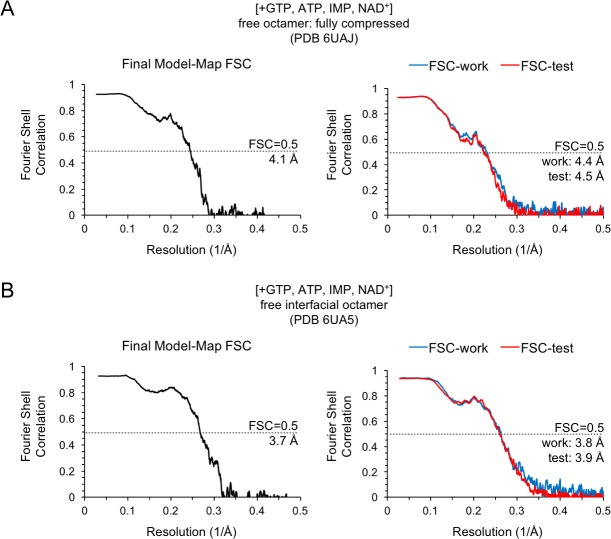
Figure 5—figure supplement 6. Model/Map FSC curves for the IMPDH2 +ATP, IMP, NAD+, 2 mM GTP cryo-EM dataset (non-filament structures).

Figure 5—figure supplement 6.

Nucleotide concentrations for this dataset: 2 mM GTP, 0.5 mM ATP, 2 mM IMP, 2 mM NAD+. For each structure, model/map Fourier shell correlations were calculated between the final map and model (left), as well as between a model refined against half-map 1 and either half-map 1 (FSC-work) or half-map 2 (FSC-test) (right). (A) Final model/map FSC curves for the for the ATP/IMP/NAD+/[2 mM]GTP fully compressed free canonical octamer. (B) Final model/map FSC curves for the ATP/IMP/NAD+/[2 mM]GTP free interfacial octamer.
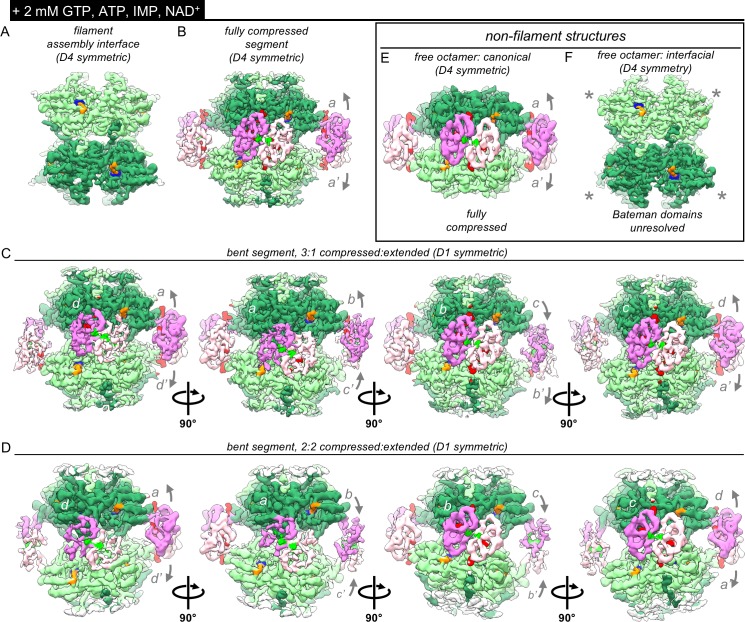
Figure 5—figure supplement 7. Bateman domains of partially inhibited IMPDH2 filaments are in a mix of compressed and extended states.

Figure 5—figure supplement 7.

Nucleotide concentrations for this dataset: 2 mM GTP, 0.5 mM ATP, 2 mM IMP, 2 mM NAD+. (A) Cryo-EM density of the consensus filament assembly interface from the ATP/IMP/NAD+/[2 mM]GTP dataset, with density for bound IMP (blue), and NAD+ (orange). (B) Cryo-EM density of the ATP/IMP/NAD+/[2 mM]GTP fully compressed filament segment, with (putative) ATP density in Bateman site 1 (bright green) and GTP in sites 2 and 3 (red). (C–D) Two D1-symmetric bent filament segments, with a mix of extended and bent protomers. The asymmetric unit of each of these is a tetramer. (E–F) Cryo-EM densities of the two different types of D4 symmetric non-filament free octamers resolved from this dataset. The Bateman domains of the free interfacial octamer were unresolved (gray asterisks).
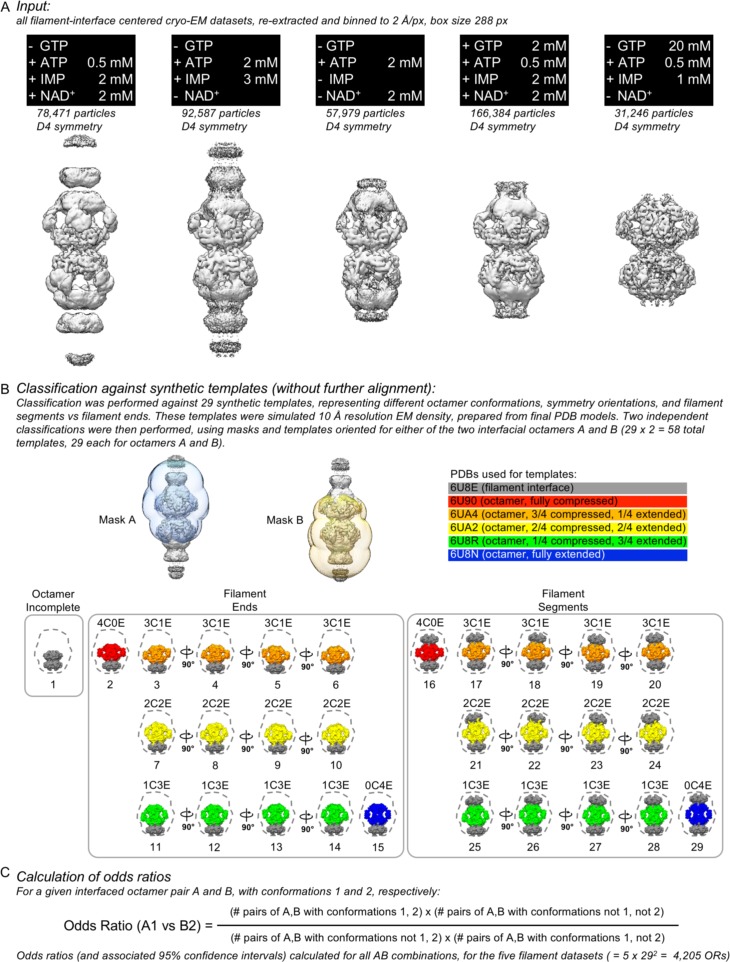
Figure 5—figure supplement 8. Classification of interfaced octamer pairs against synthetic templetes, and calculation of interfaced octamer odds ratios.

Figure 5—figure supplement 8.

(A) The five interface-centered filament datasets were re-extracted to a common pixel size and box size, large enough to contain both interface octamers (nucleotide concentrations were as shown). (B) Low resolution synthetic templates were prepared by combining chains from six of the final molecular models and simulating the EM density, and the interface datasets were classified against these templates using masks to focus on a single octamer. (C) Formula used for calculation of odds ratios.
Figure 5—figure supplement 9. Interfaced octamer odds ratios for the 0.5 mM ATP, 2 mM IMP, 2 mM NAD+ cryo-EM dataset.

Figure 5—figure supplement 9.

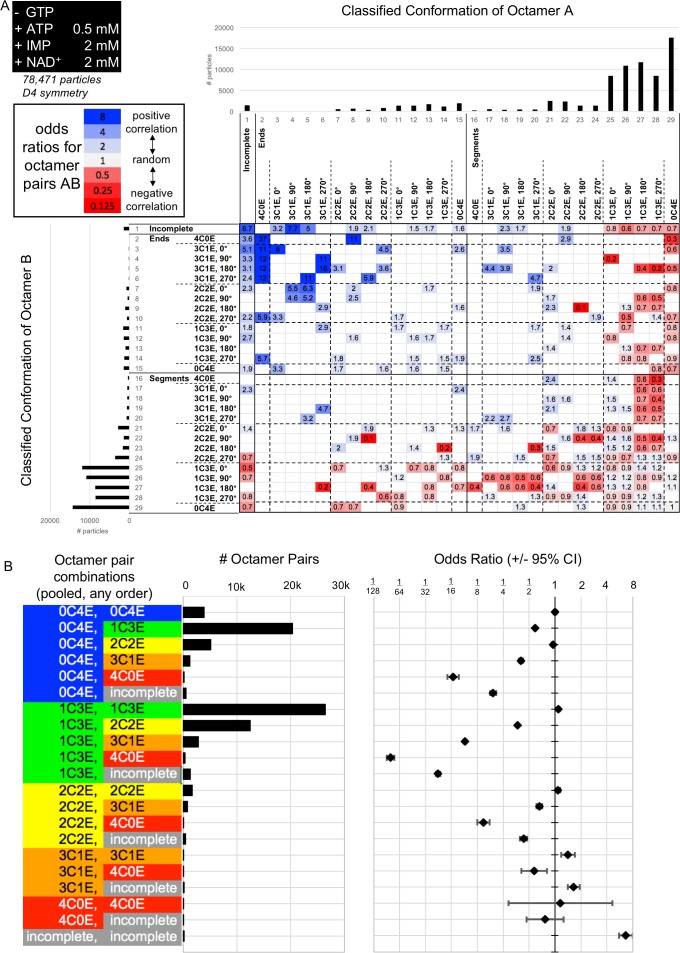
(A) Class distribution histograms and odds ratios for all combinations of classes of octamer A vs octamer B. Only ORs for which the associated 95% confidence interval does not include 1 are displayed. (B) A simplified summary of odds ratio data, made by pooling all classes depicted in A into the 21 different categories at left, irrespective of orientation, end vs segment, or A/B order. Center, histogram of # of octamer pairs per category. Right, odds ratios (error bars indicate 95% confidence interval). Abbreviations are as follow: 4C0E = fully compressed; 3C1E = 3/4 compressed, ¼ extended; 2C2E = 2/4 compressed, 2/4 extended; 1C3E = 1/4 compressed, 3/4 extended; 0C4E = fully extended.
Figure 5—figure supplement 10. Interfaced octamer odds ratios for the 2 mM ATP, 3 mM IMP cryo-EM dataset.

Figure 5—figure supplement 10.

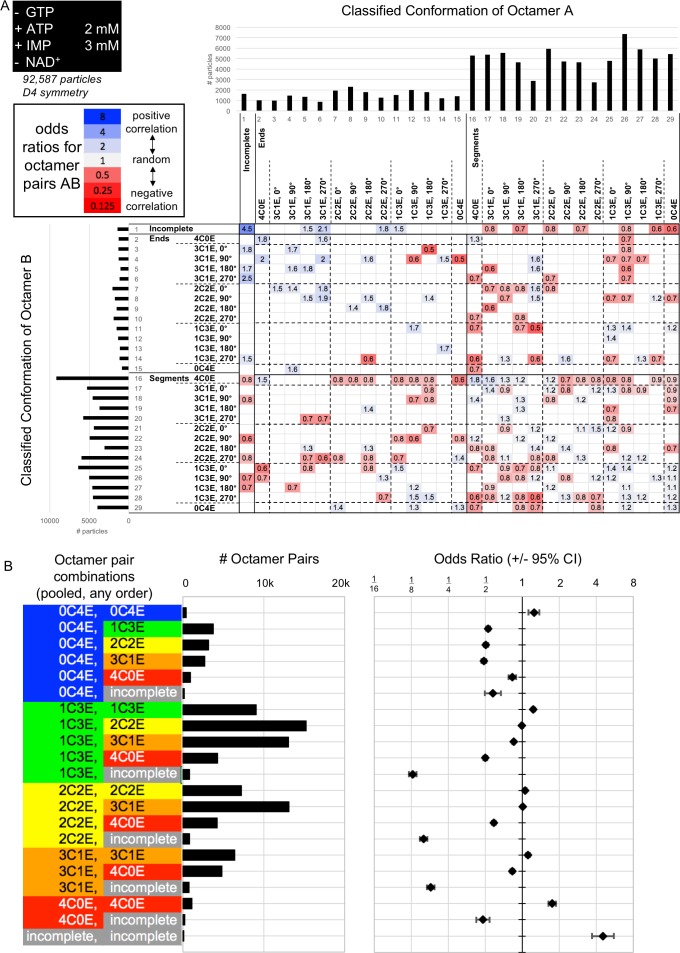
(A) Class distribution histograms and odds ratios for all combinations of classes of octamer A vs octamer B. Only ORs for which the associated 95% confidence interval does not include 1 are displayed. (B) A simplified summary of odds ratio data, made by pooling all classes depicted in A into the 21 different categories at left, irrespective of orientation, end vs segment, or A/B order. Center, histogram of # of octamer pairs per category. Right, odds ratios (error bars indicate 95% confidence interval). Abbreviations are as follow: 4C0E = fully compressed; 3C1E = 3/4 compressed, ¼ extended; 2C2E = 2/4 compressed, 2/4 extended; 1C3E = 1/4 compressed, 3/4 extended; 0C4E = fully extended.
Figure 5—figure supplement 11. Interfaced octamer odds ratios for the 2 ATP, 2 mM NAD+ cryo-EM dataset.

Figure 5—figure supplement 11.

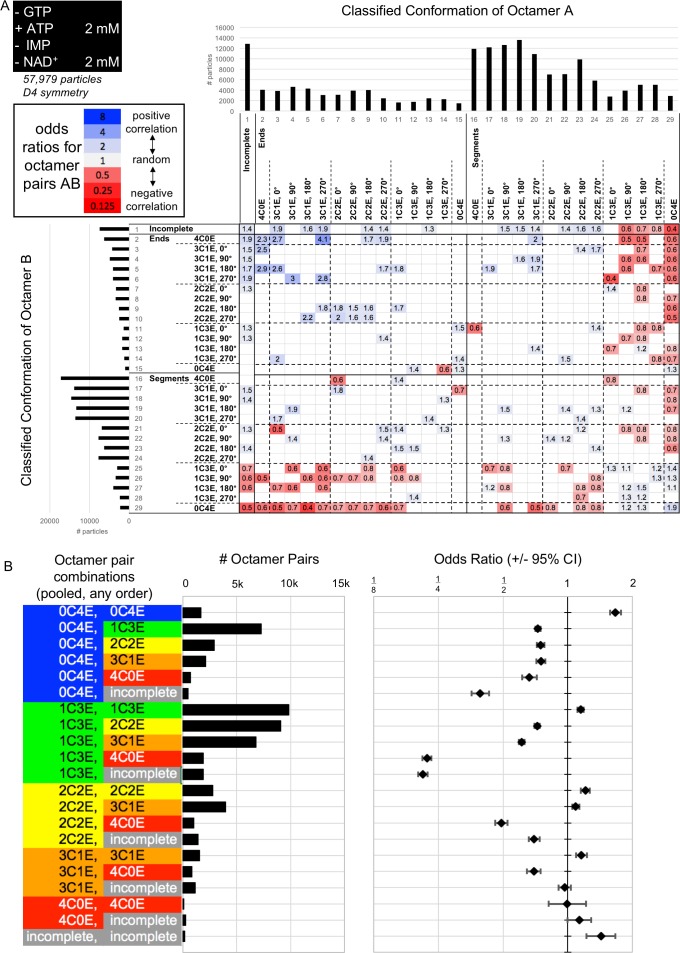
(A) Class distribution histograms and odds ratios for all combinations of classes of octamer A vs octamer B. Only ORs for which the associated 95% confidence interval does not include 1 are displayed. (B) A simplified summary of odds ratio data, made by pooling all classes depicted in A into the 21 different categories at left, irrespective of orientation, end vs segment, or A/B order. Center, histogram of # of octamer pairs per category. Right, odds ratios (error bars indicate 95% confidence interval). Abbreviations are as follow: 4C0E = fully compressed; 3C1E = 3/4 compressed, ¼ extended; 2C2E = 2/4 compressed, 2/4 extended; 1C3E = 1/4 compressed, 3/4 extended; 0C4E = fully extended.
Figure 5—figure supplement 12. Interfaced octamer odds ratios for the 2 mM GTP, 0.5 mM ATP, 2 mM IMP, 2 mM NAD+ cryo-EM dataset.

Figure 5—figure supplement 12.

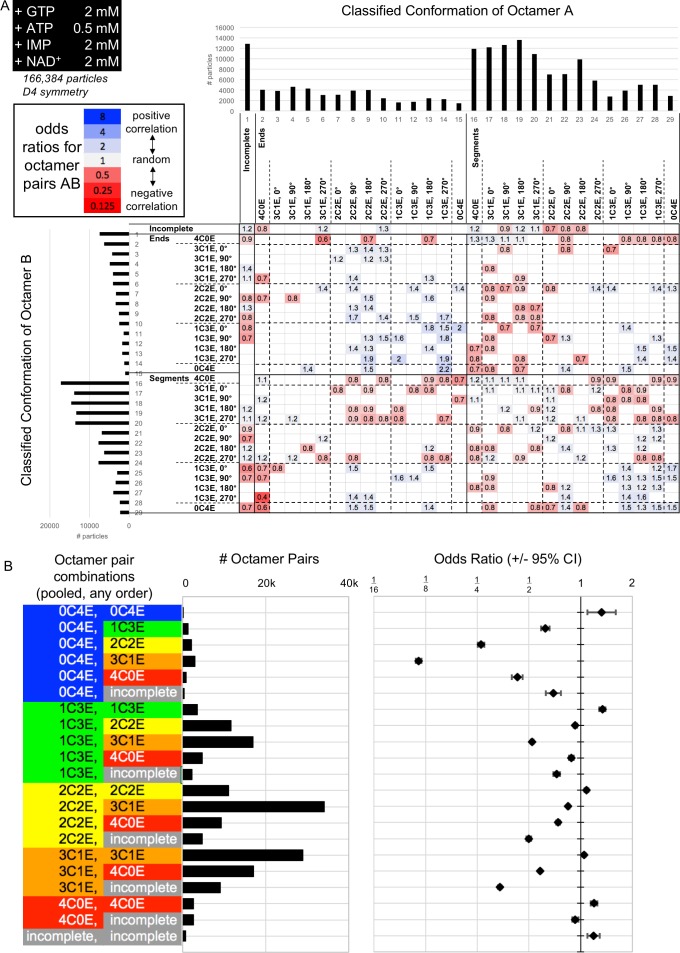
(A) Class distribution histograms and odds ratios for all combinations of classes of octamer A vs octamer B. Only ORs for which the associated 95% confidence interval does not include 1 are displayed. (B) A simplified summary of odds ratio data, made by pooling all classes depicted in A into the 21 different categories at left, irrespective of orientation, end vs segment, or A/B order. Center, histogram of # of octamer pairs per category. Right, odds ratios (error bars indicate 95% confidence interval). Abbreviations are as follow: 4C0E = fully compressed; 3C1E = 3/4 compressed, ¼ extended; 2C2E = 2/4 compressed, 2/4 extended; 1C3E = 1/4 compressed, 3/4 extended; 0C4E = fully extended.
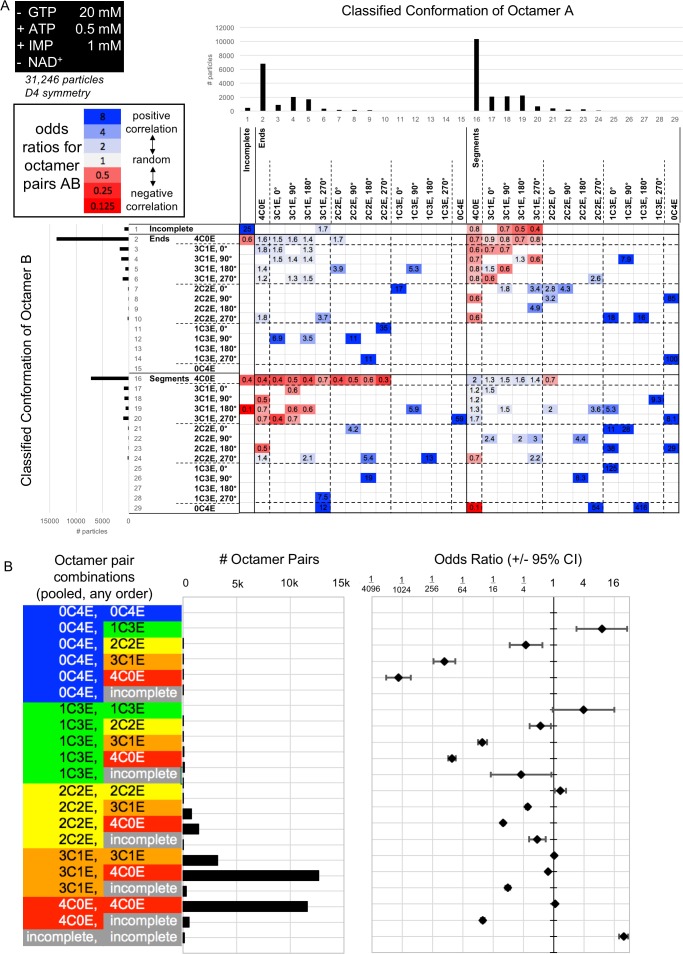
Figure 5—figure supplement 13. Interfaced octamer odds ratios for the 20 mM GTP, 0.5 mM ATP, 1 mM IMP cryo-EM dataset.

Figure 5—figure supplement 13.

(A) Class distribution histograms and odds ratios for all combinations of classes of octamer A vs octamer B. Only ORs for which the associated 95% confidence interval does not include 1 are displayed. (B) A simplified summary of odds ratio data, made by pooling all classes depicted in A into the 21 different categories at left, irrespective of orientation, end vs segment, or A/B order. Center, histogram of # of octamer pairs per category. Right, odds ratios (error bars indicate 95% confidence interval). Abbreviations are as follow: 4C0E = fully compressed; 3C1E = 3/4 compressed, ¼ extended; 2C2E = 2/4 compressed, 2/4 extended; 1C3E = 1/4 compressed, 3/4 extended; 0C4E = fully extended.