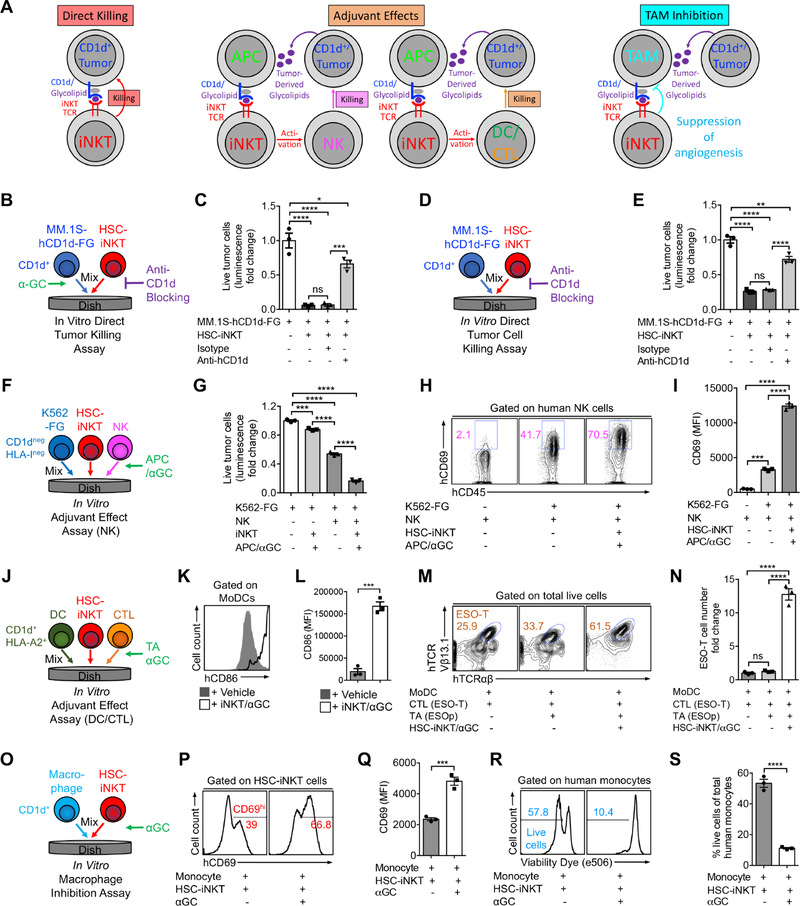
Figure 5. Tumor-Attacking Mechanisms of HSC-iNKT Cells.
(A) Diagram showing the possible mechanisms utilized by human iNKT cells to attack tumor cells. APC, antigen presenting cell; NK, natural killer cell; DC, dendritic cell; CTL, cytotoxic T lymphocyte; TAM, tumor-associated macrophage.
(B-E) Studying the direct killing of CD1d+ tumor cells by HSC-iNKT cells (tumor:iNKT ratio 1:10). (B) Experimental design to study CD1d-dependent killing of MM.1S-hCD1d-FG cells in the presence of αGC. (C) Tumor killing data from B (n = 3). (D) Experimental design to study CD1d-dependent killing of MM.1S-hCD1d-FG cells in the absence of αGC. (E) Tumor killing data from D (n = 3).
(F-I) Studying the adjuvant effects of HSC-iNKT cells on enhancing NK cell-mediated killing of tumor cells (tumor:NK:iNKT ratio 1:2:2). (F) Experimental design. (G) Tumor killing (n = 3). (H) FACS plots showing CD69 expression on NK cells. (I) Quantification of H (n = 3).
(J-N) Studying the adjuvant effects of HSC-iNKT cells on boosting DC/CTL antitumor reactions (DC:CTL:iNKT ratio 1:1:1). (J) Experimental design. (K) FACS plots showing CD86 expression on MoDCs. (L) Quantification of K (n = 3). (M) FACS plots showing the detection of ESO-T cells in the mixed cell culture. (N) Quantification of M (n = 3).
(O-S) Studying the inhibition of macrophages by HSC-iNKT cells (macrophage:iNKT ratio 1:1). Monocytes isolated from healthy donor PBMCs were studied. (O) Experimental design. (P) FACS plots showing CD69 expression on HSC-iNKT cells. (Q) Quantification of P (n = 3). (R) FACS plots showing the viability of monocytes. (S) Quantification of R (n = 3).
Representative of 2 experiments. See also Figures S5 and S6.

