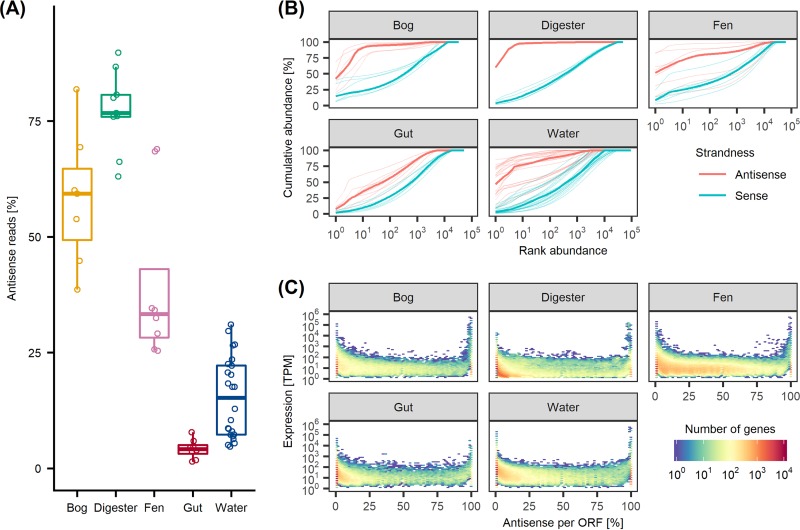
FIG 1.
Antisense transcription is a substantial amount of the data and dominated by few genes. (A) Percentage of sequenced reads which are antisense for each sample, grouped by community. (B) Rank-abundance curves for all samples within each community, colored by strandness. The x axis lists genes ranked in descending order according to relative abundance, while the y axis shows the cumulative abundance. Bold lines indicate the median for each colored group. (C) Relative amount of antisense expression for each observation (x axis) and total antisense and sense expression normalized to transcripts per million (TPM) (y axis). For results in this figure, sample-wide data sets were used (see Materials and Methods for details). ORF, open reading frame.

