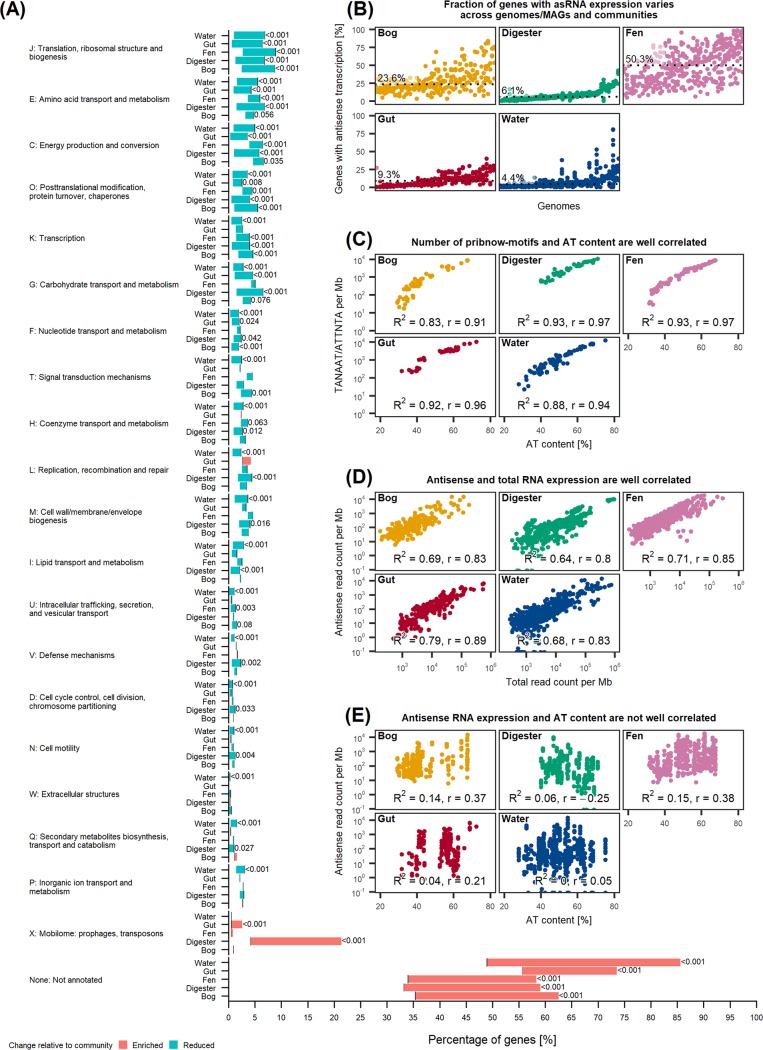
FIG 2.
Antisense transcription is not function specific and may be driven by several factors. (A) Listed from top to bottom is the enrichment/reduction for each COG functional category for each community, with the x axis showing the percentage of genes in either the COG functional category or the entire community. Note the break between 10% and 50% on the x axis, where the group of nonannotated genes extends across the whole figure from left to right. The black vertical line at each horizontal bar indicates the percentage of annotated genes in the whole community, while bars indicate either percent reduction or enrichment in the subset of antisense-enriched genes, defined as genes with ≥95% of reads being antisense RNA. Only two-tailed adjusted P values of <0.2 are shown (see Materials and Methods for details). Shown are total numbers of genes and antisense-enriched subsets in digester (total, 48,889; subset, 936 [1.9%]), human gut (total, 53,059; subset, 927 [1.8%]), water (total, 95,695; subset, 5,339 [5.6%]), fen (total, 62,381; subset, 1,759 [2.8%]), and bog (total, 33,258; subset, 1,470 [4.4%]) samples. (B) For each community, genomes are plotted along the x axis, and the percentages of genes with significant (adjusted P value of <0.05) antisense expression within each genome are plotted on the y axis. Points located above the same genome represent the same genome across different samples. For each community, genomes are ordered along the x axis according to the median. Dotted lines and values indicate the median genome-wide percentages of genes with antisense transcription for each community. (C) Percent AT content for a given genome (x axis) and the number of Pribnow motifs in both directions of the sequence, normalized by genome length (y axis). (D) Number of sense RNA counts (x axis) and antisense RNA counts (y axis), normalized by genome length. (E) Percent AT content for a given genome (x axis) and number of antisense RNA read counts normalized by genome length (y axis). For this plot, genome-wide data sets were used (see Materials and Methods for details).

