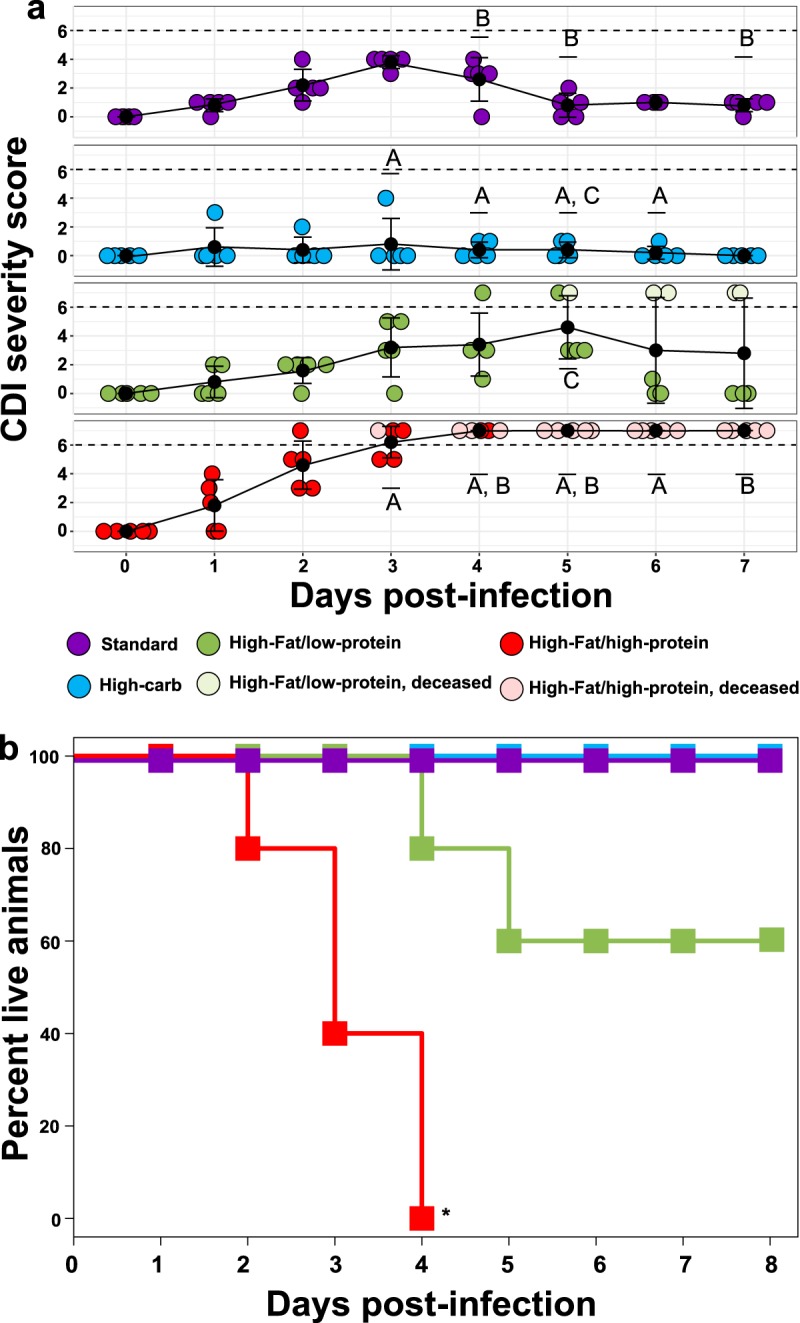
FIG 2.

Effect of diet on mouse survival and CDI severity postinfection. (a) Mean disease severity scores (black dots with connected black trendline) for each diet following CDI challenge; 25th and 75th percentiles are shown. Colored dots represent severity scores for individual mice. Dashed lines represent a score of 6, the clinical endpoint. Groups marked A, B, or C indicate statistically significant differences (P < 0.05, two-way repeated-measures [ANOVA]) in disease severity between mice fed a high-carbohydrate diet versus a high-fat/high-protein diet (letter A), a standard laboratory diet versus a high-fat/high-protein diet (letter B), or a high-carbohydrate diet versus high-fat/low-protein diet (letter C). There were significant (P ≤ 0.001, two-way repeated-measures ANOVA, **) changes in CDI severity through time in infected mice fed a standard laboratory diet and a high-fat/high-protein diet. (b) Kaplan-Meier survival curves for mice fed a high-carbohydrate diet (blue, n = 5), high-fat/low-protein diet (green, n = 5), high-fat/high-protein diet (red, n = 5), and standard laboratory diet (purple, n = 5), all following CDI challenge. The high-fat/high-protein diet significantly (P = 0.003, log rank test, *) reduced survival of infected mice. All uninfected mice fed the standard laboratory diet showed no CDI signs (score of 0) for the duration of the experiment (not shown).
