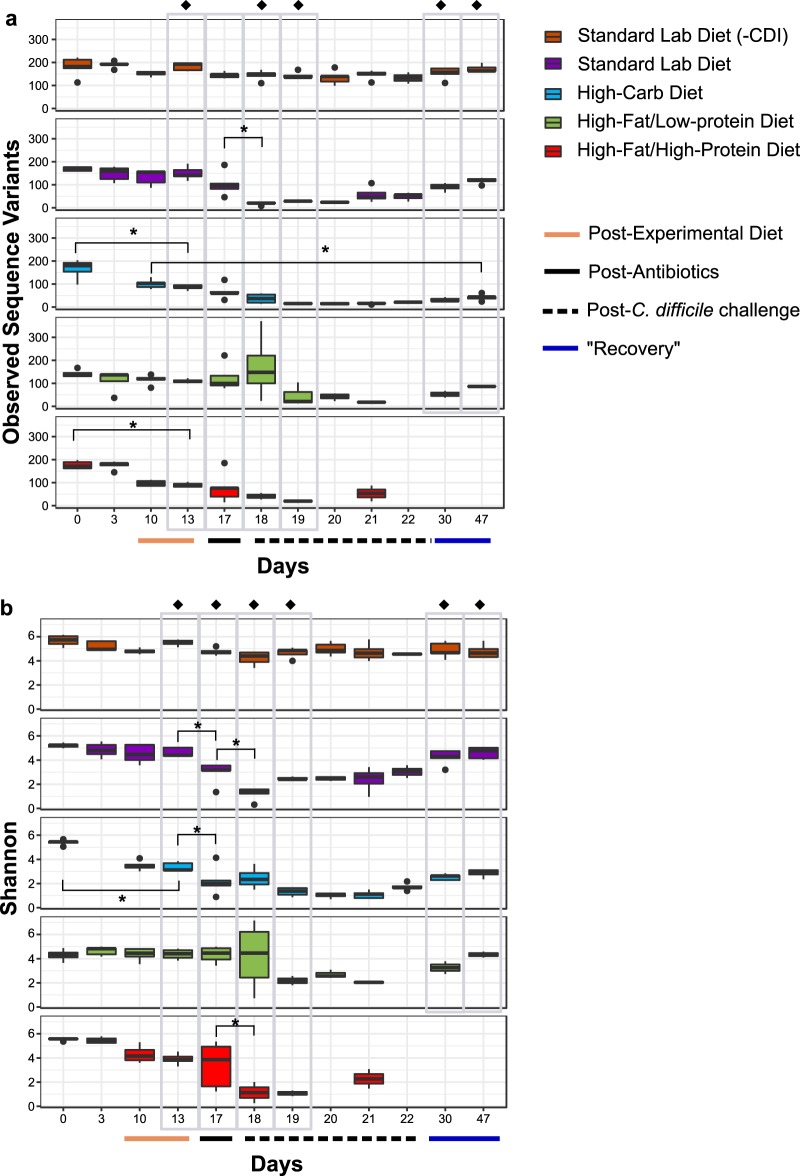
FIG 3.
Effect of diet and treatment on alpha diversity. (a) Observed sequence variants (SV) and (b) Shannon diversity were calculated for uninfected mice fed a standard laboratory diet (orange, n = 5) and for infected mice fed a standard laboratory diet (purple, n = 5), high-carbohydrate diet (blue, n = 5), high-fat/low-protein diet (green, n = 5), or high-fat/high-protein diet (red, n = 5). Gray boxes highlight comparisons between groups after a change in diet on day 13 and antibiotic treatments on day 17, postinfection on days 18 and 19, and recovery on days 30 and 47. Administration of experimental diets (solid tan line, x axis) and time points after antibiotics administration (solid black line, x axis) and C. difficile challenge (dashed black line, x axis) are indicated. Black dots above and below box plots represent outliers. Asterisks (*) indicate significant (P < 0.05) loss of diversity in within-group pairwise comparisons. Filled diamonds (◆) indicate significant (P < 0.05 [ANOVA]) differences between groups on a given day.

